VictoriaMetrics 写入吞吐和数据压缩比 测试

VictoriaMetrics 写入吞吐和数据压缩比 测试

测试结果

对比项 X2.0 vectoria metircs score
写入吞吐 x 886k/s(1.66m/s)
压缩比(源json) x 0.22%

benchmark 数据源配置

pod 4c6G

数据生成速率

1
2
3
3000*1230 active time series
scrapeInterval 10秒,1230*3K/10 369k samples/sec
每10分钟 更新10% time series

数据协议,prometheus remote write

数据格式(转json 后)

1
2
3
{"metric":{"__name__":"node_scrape_collector_success","job":"node_exporter","instance":"host-2362","collector":"mdadm","replica":"0","revision":"r0","url_replica":"0"},"values":[1],"timestamps":[1724313603243]}
{"metric":{"__name__":"node_textfile_scrape_error","job":"node_exporter","instance":"host-1398","replica":"0","revision":"r5","url_replica":"0"},"values":[0],"timestamps":[1724313609919]}
{"metric":{"__name__":"node_textfile_scrape_error","job":"node_exporter","instance":"host-1902","replica":"0","revision":"r0","url_replica":"0"},"values":[0],"timestamps":[1724313604325]}

Vectoria Metrics 测试过程

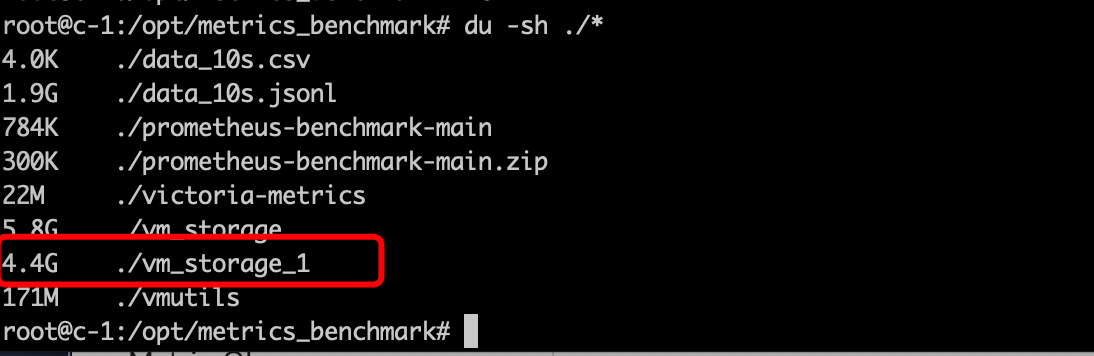
14:48分开始- 18:29分结束 , 总条数:11761224464 117.6亿 , 占用4.4G磁盘

压缩比

1
2
3
4
5
6
7
vectoria_metrics   11761224464   117.6亿  4.4G
prometheus_jsonl 8842910 884万 1.86G (10s)
json压缩率: 4.4/(11761224464/8842910 * 1.86) = 0.0017786168346660843 0.18%

vectoria_metrics 21919476860 219亿 10.3G
prometheus_jsonl 8842910 884万 1.86G (10s)
json压缩率: 10.3/(21919476860/8842910 * 1.86) = 0.0022340315419449312 0.22%

写入吞吐

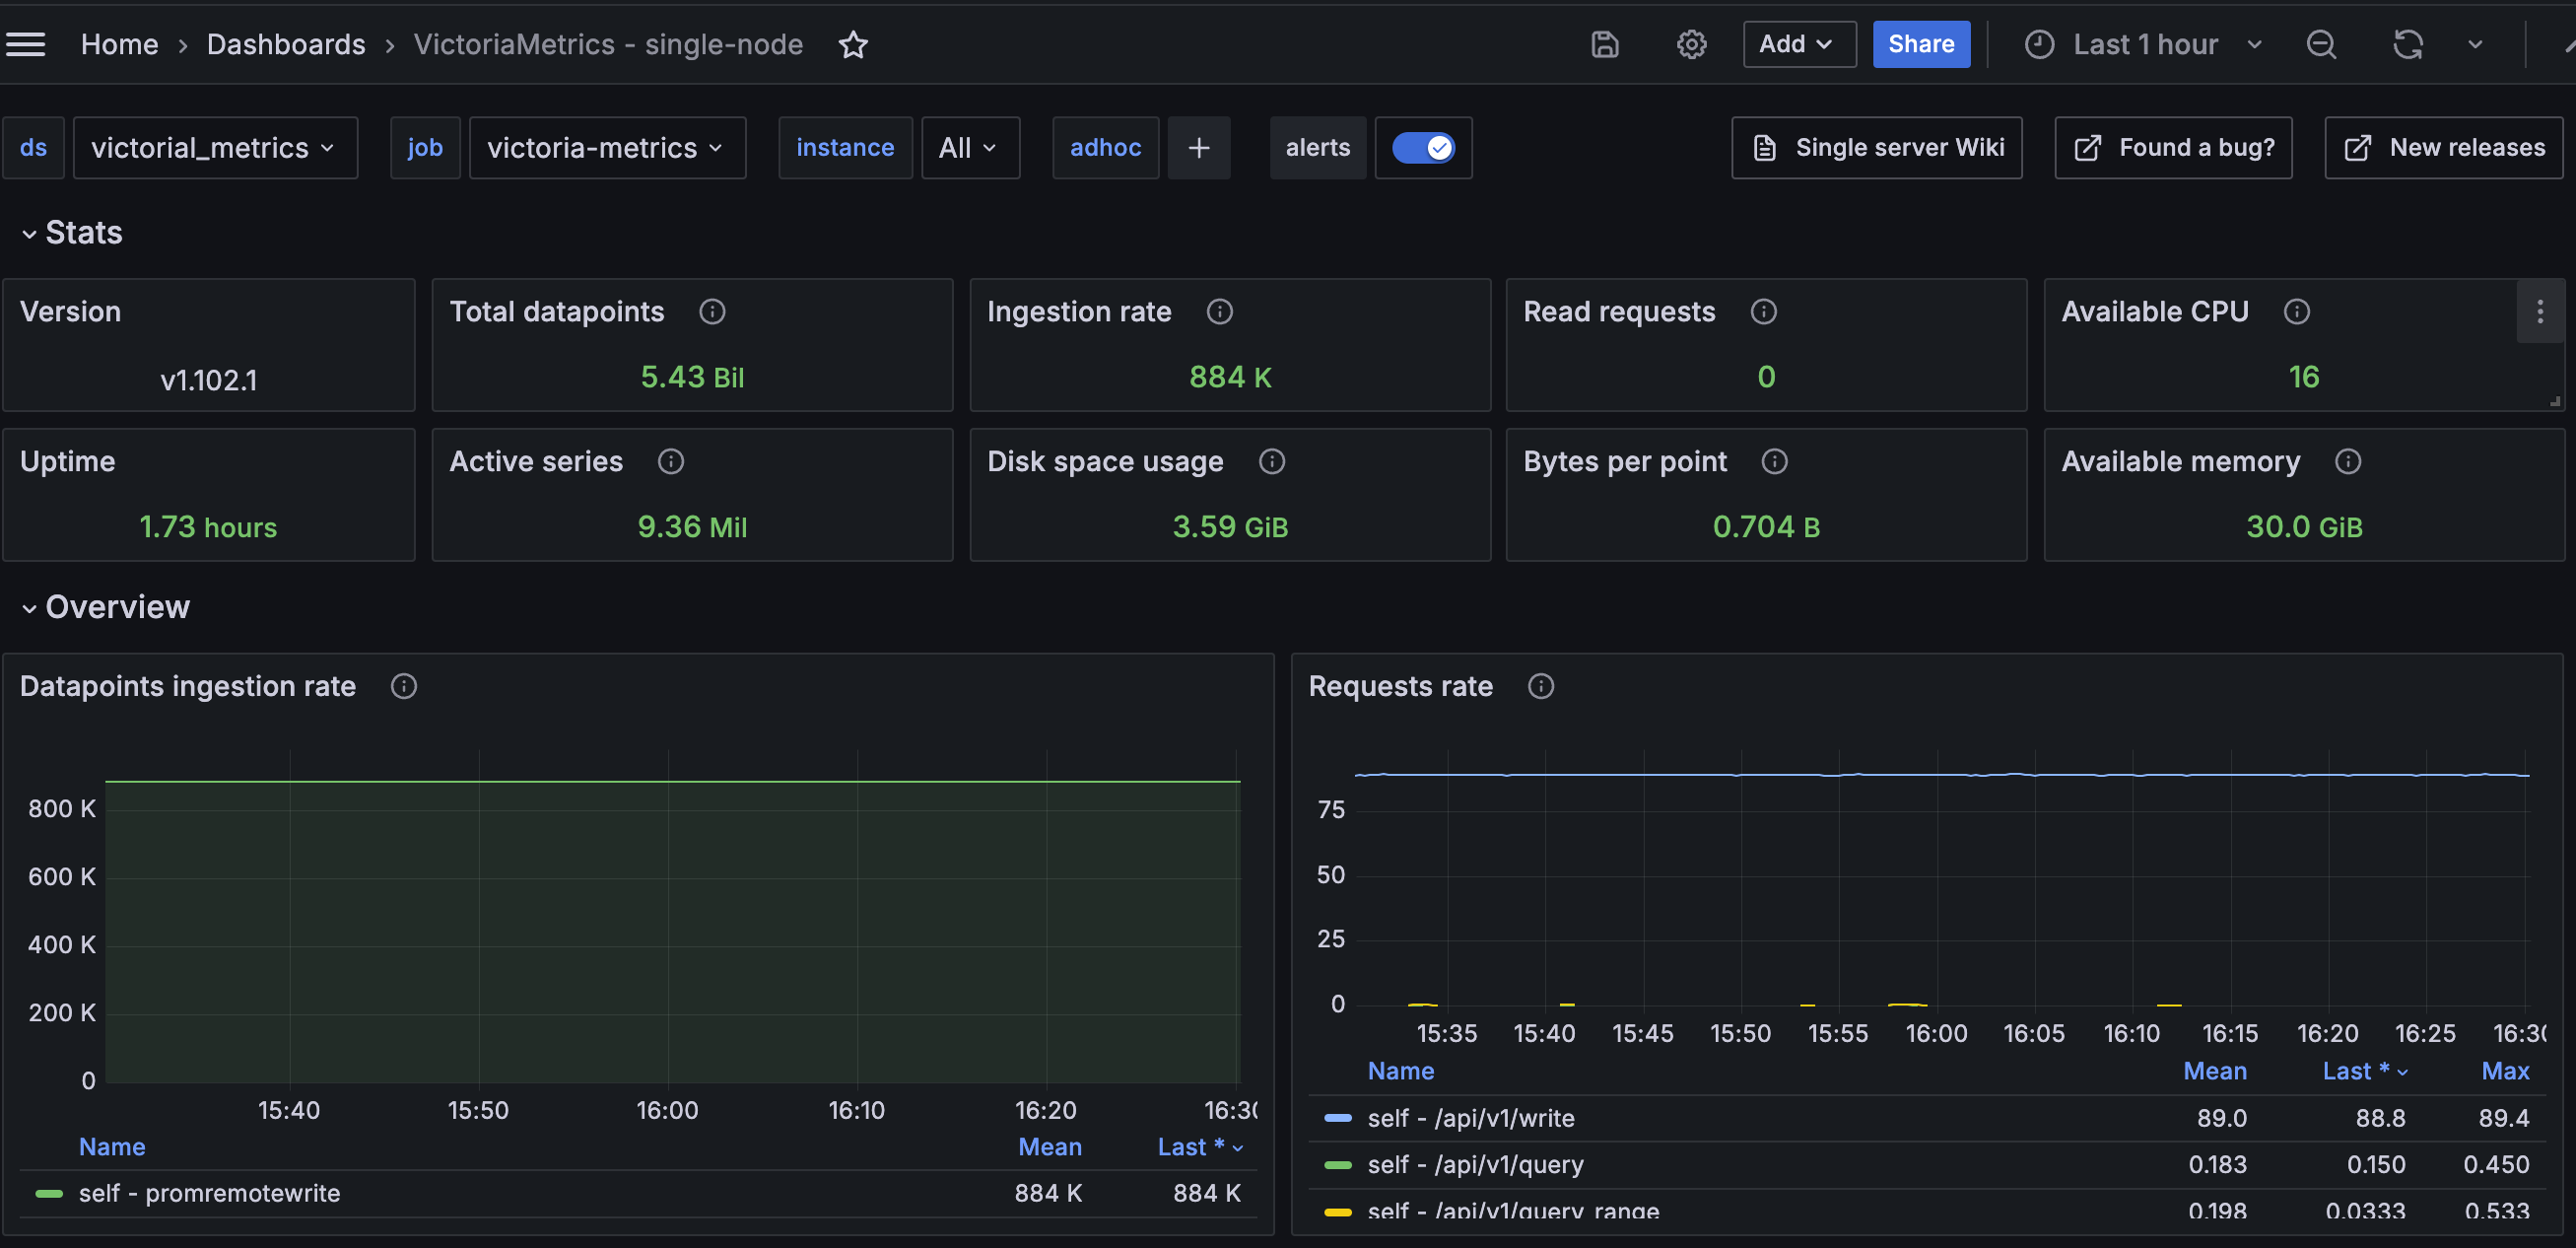
884k points/sec

中间试过起3个benchmark 同时打数据,2个 1.27m/s 3个到 1.66m/sec
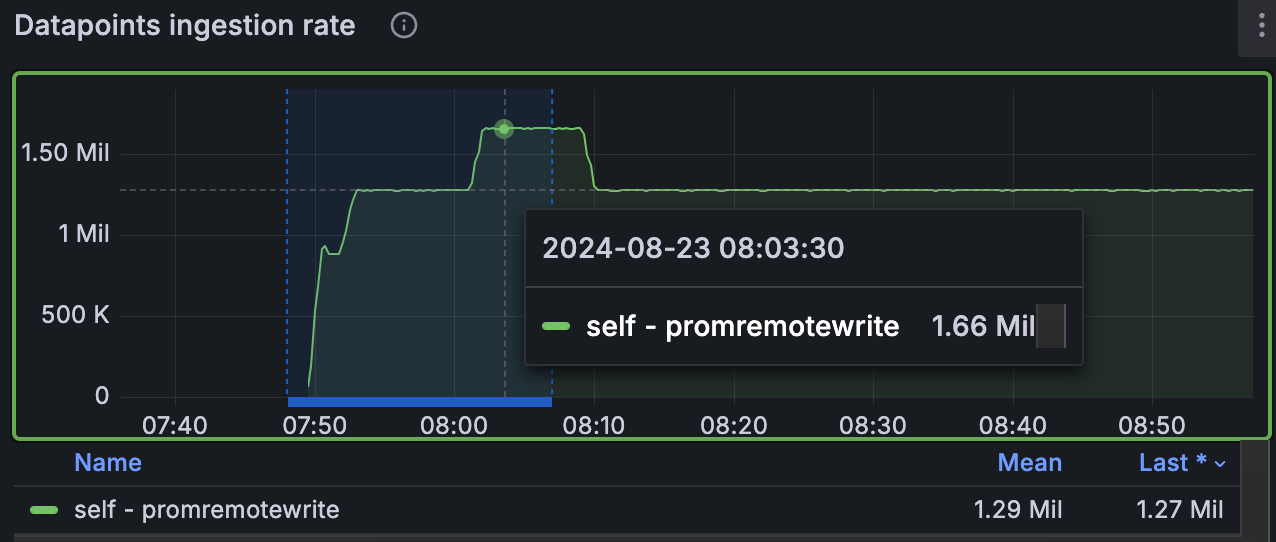
image-20240823105126314

消耗资源

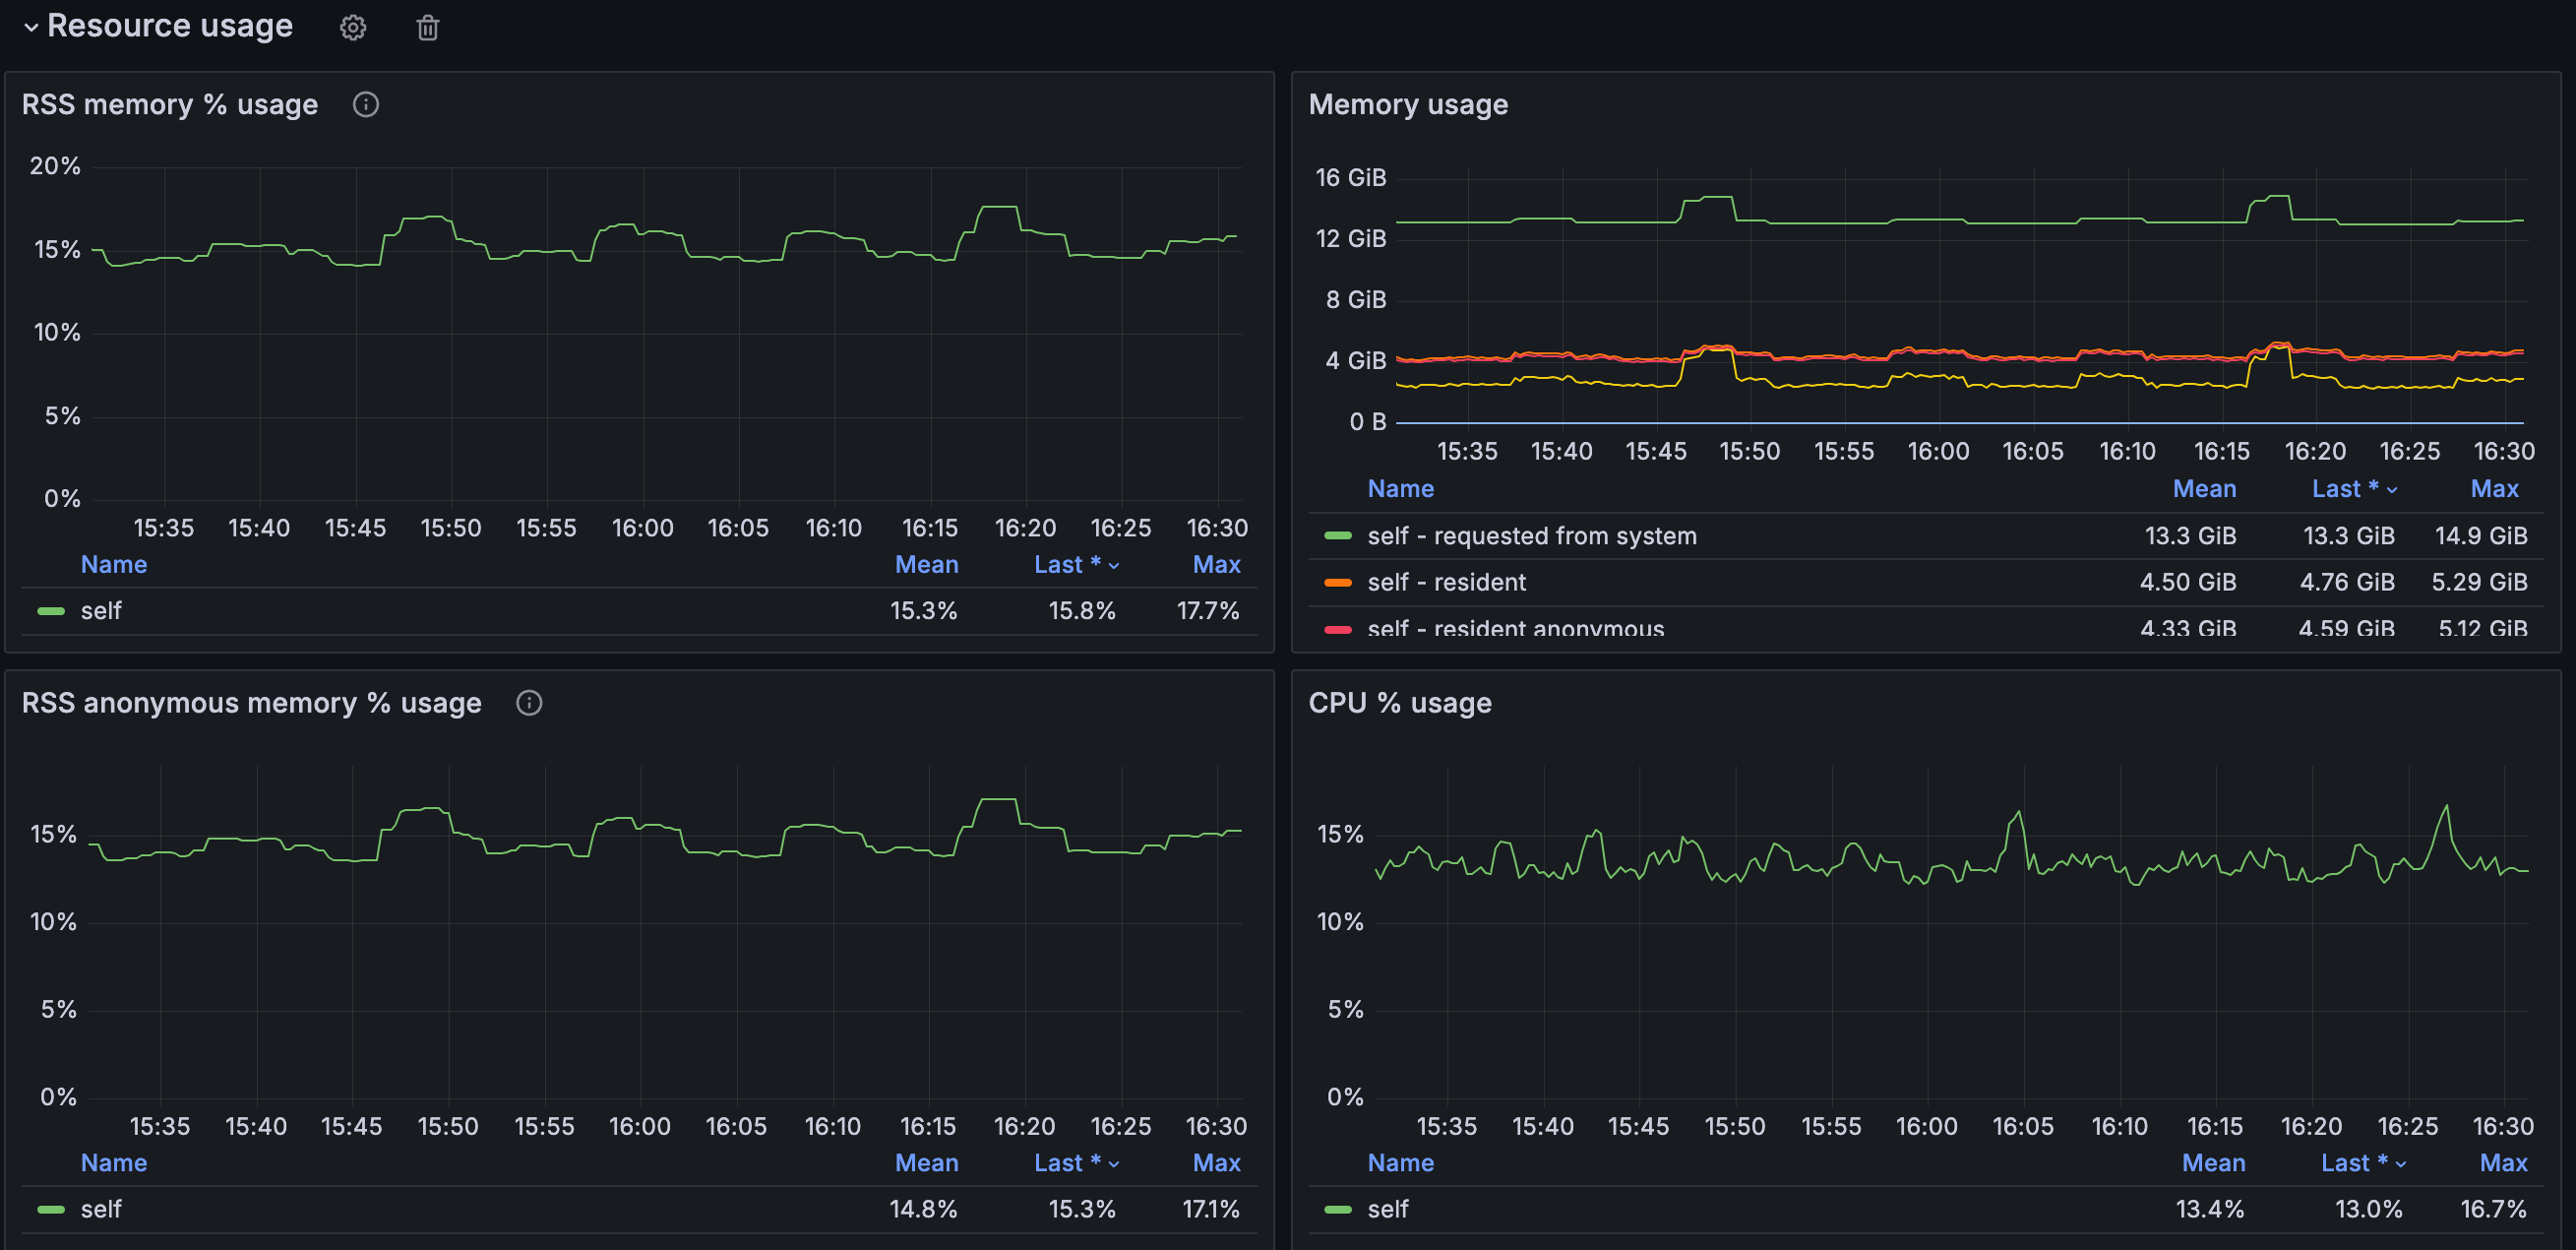
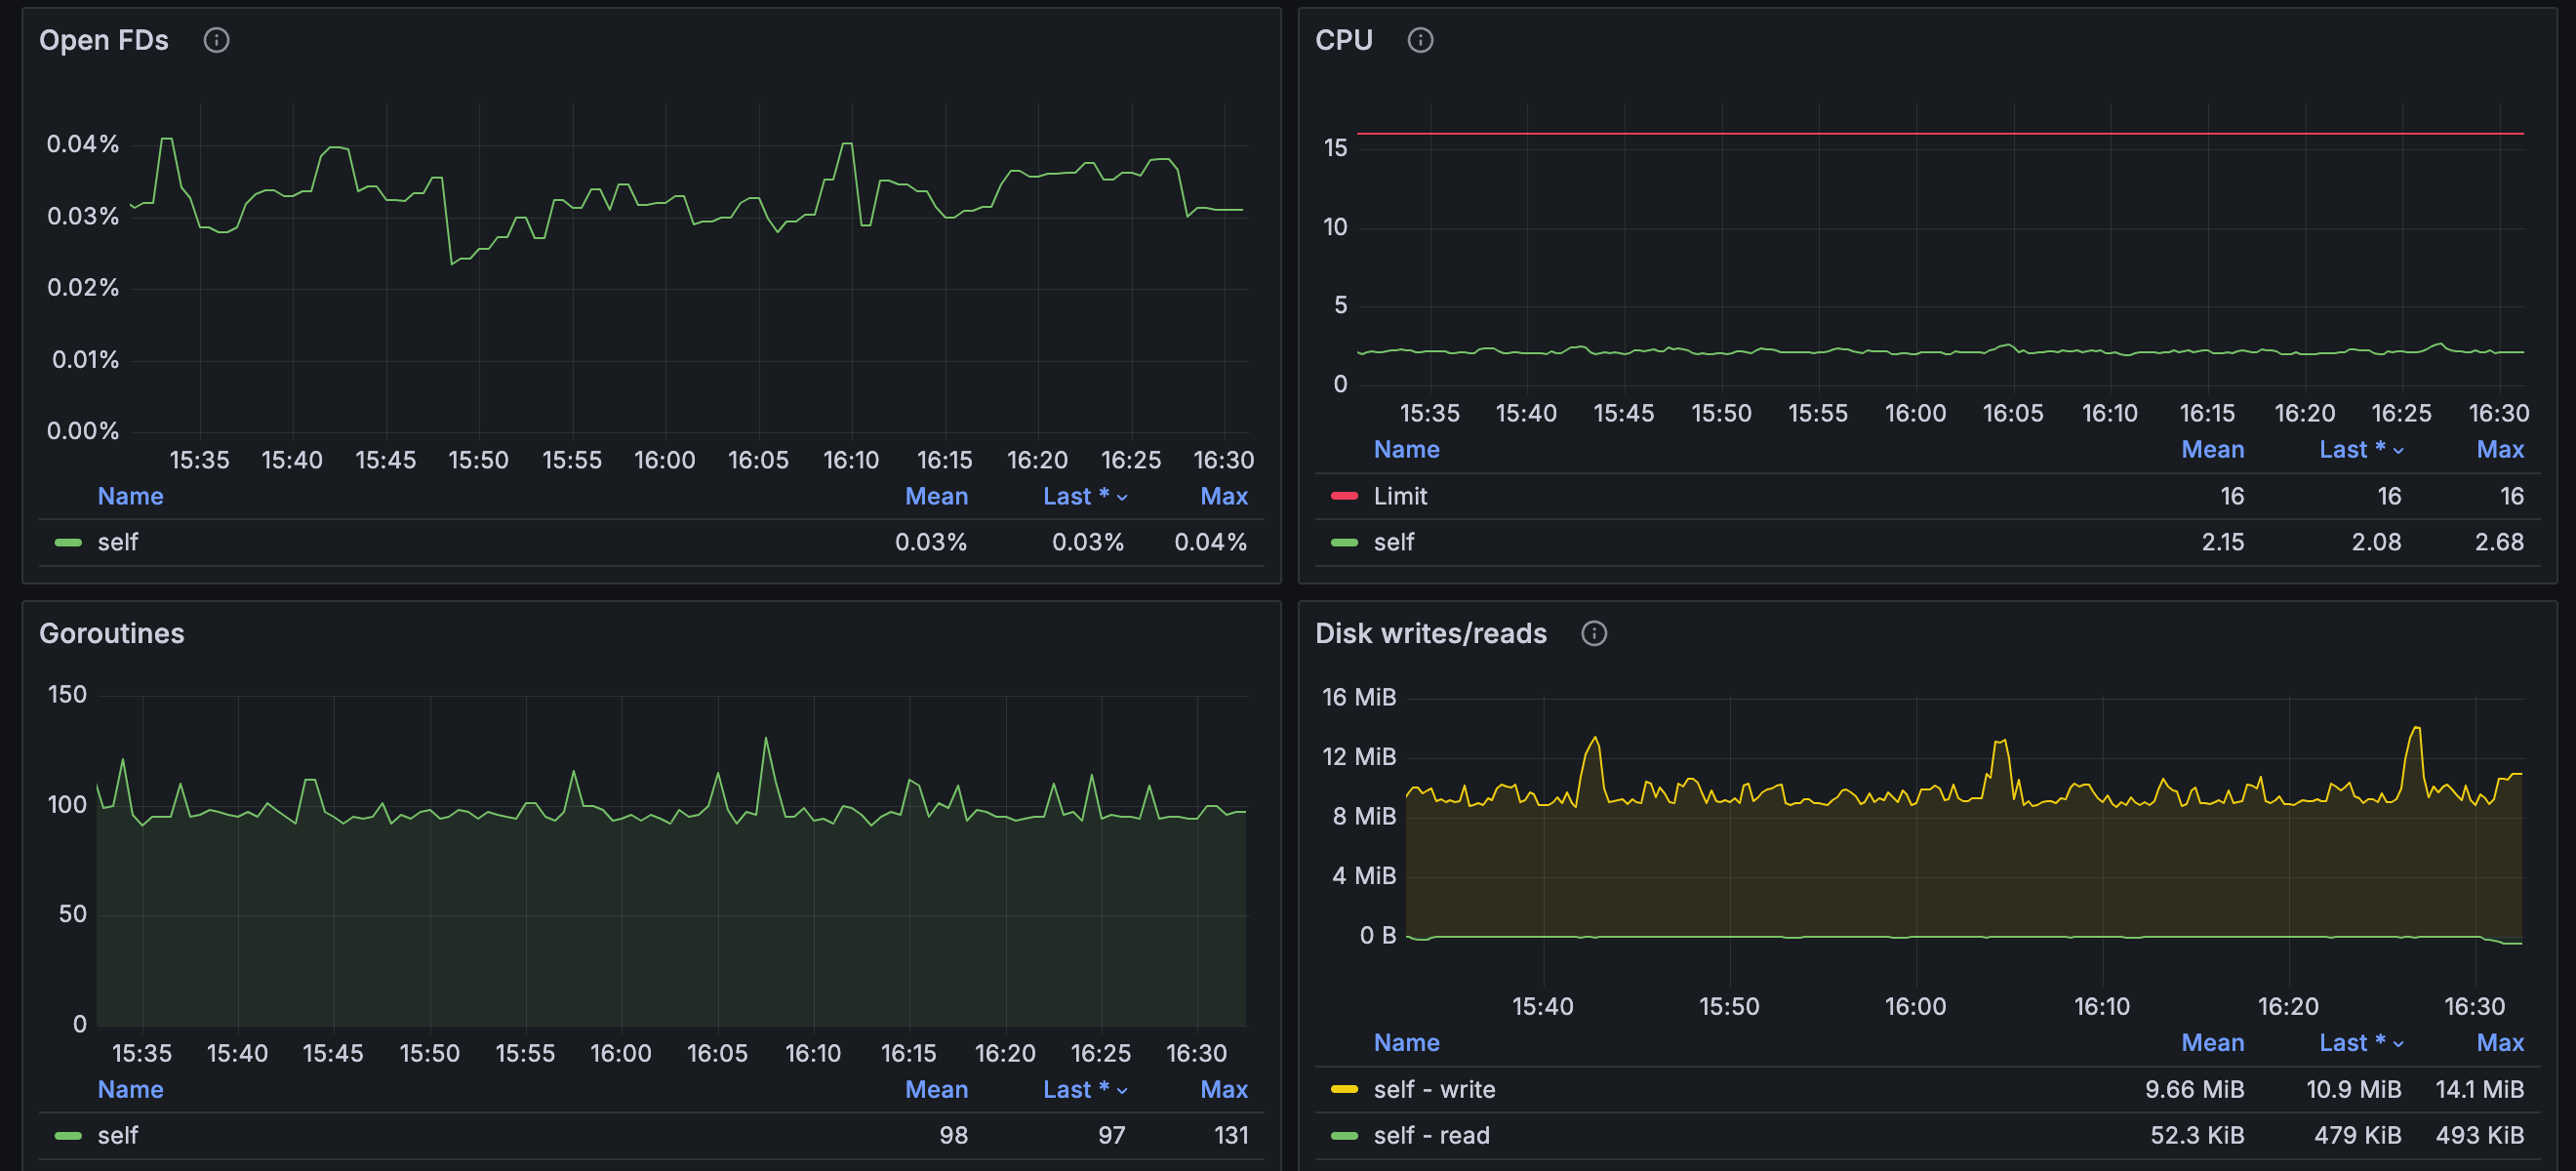
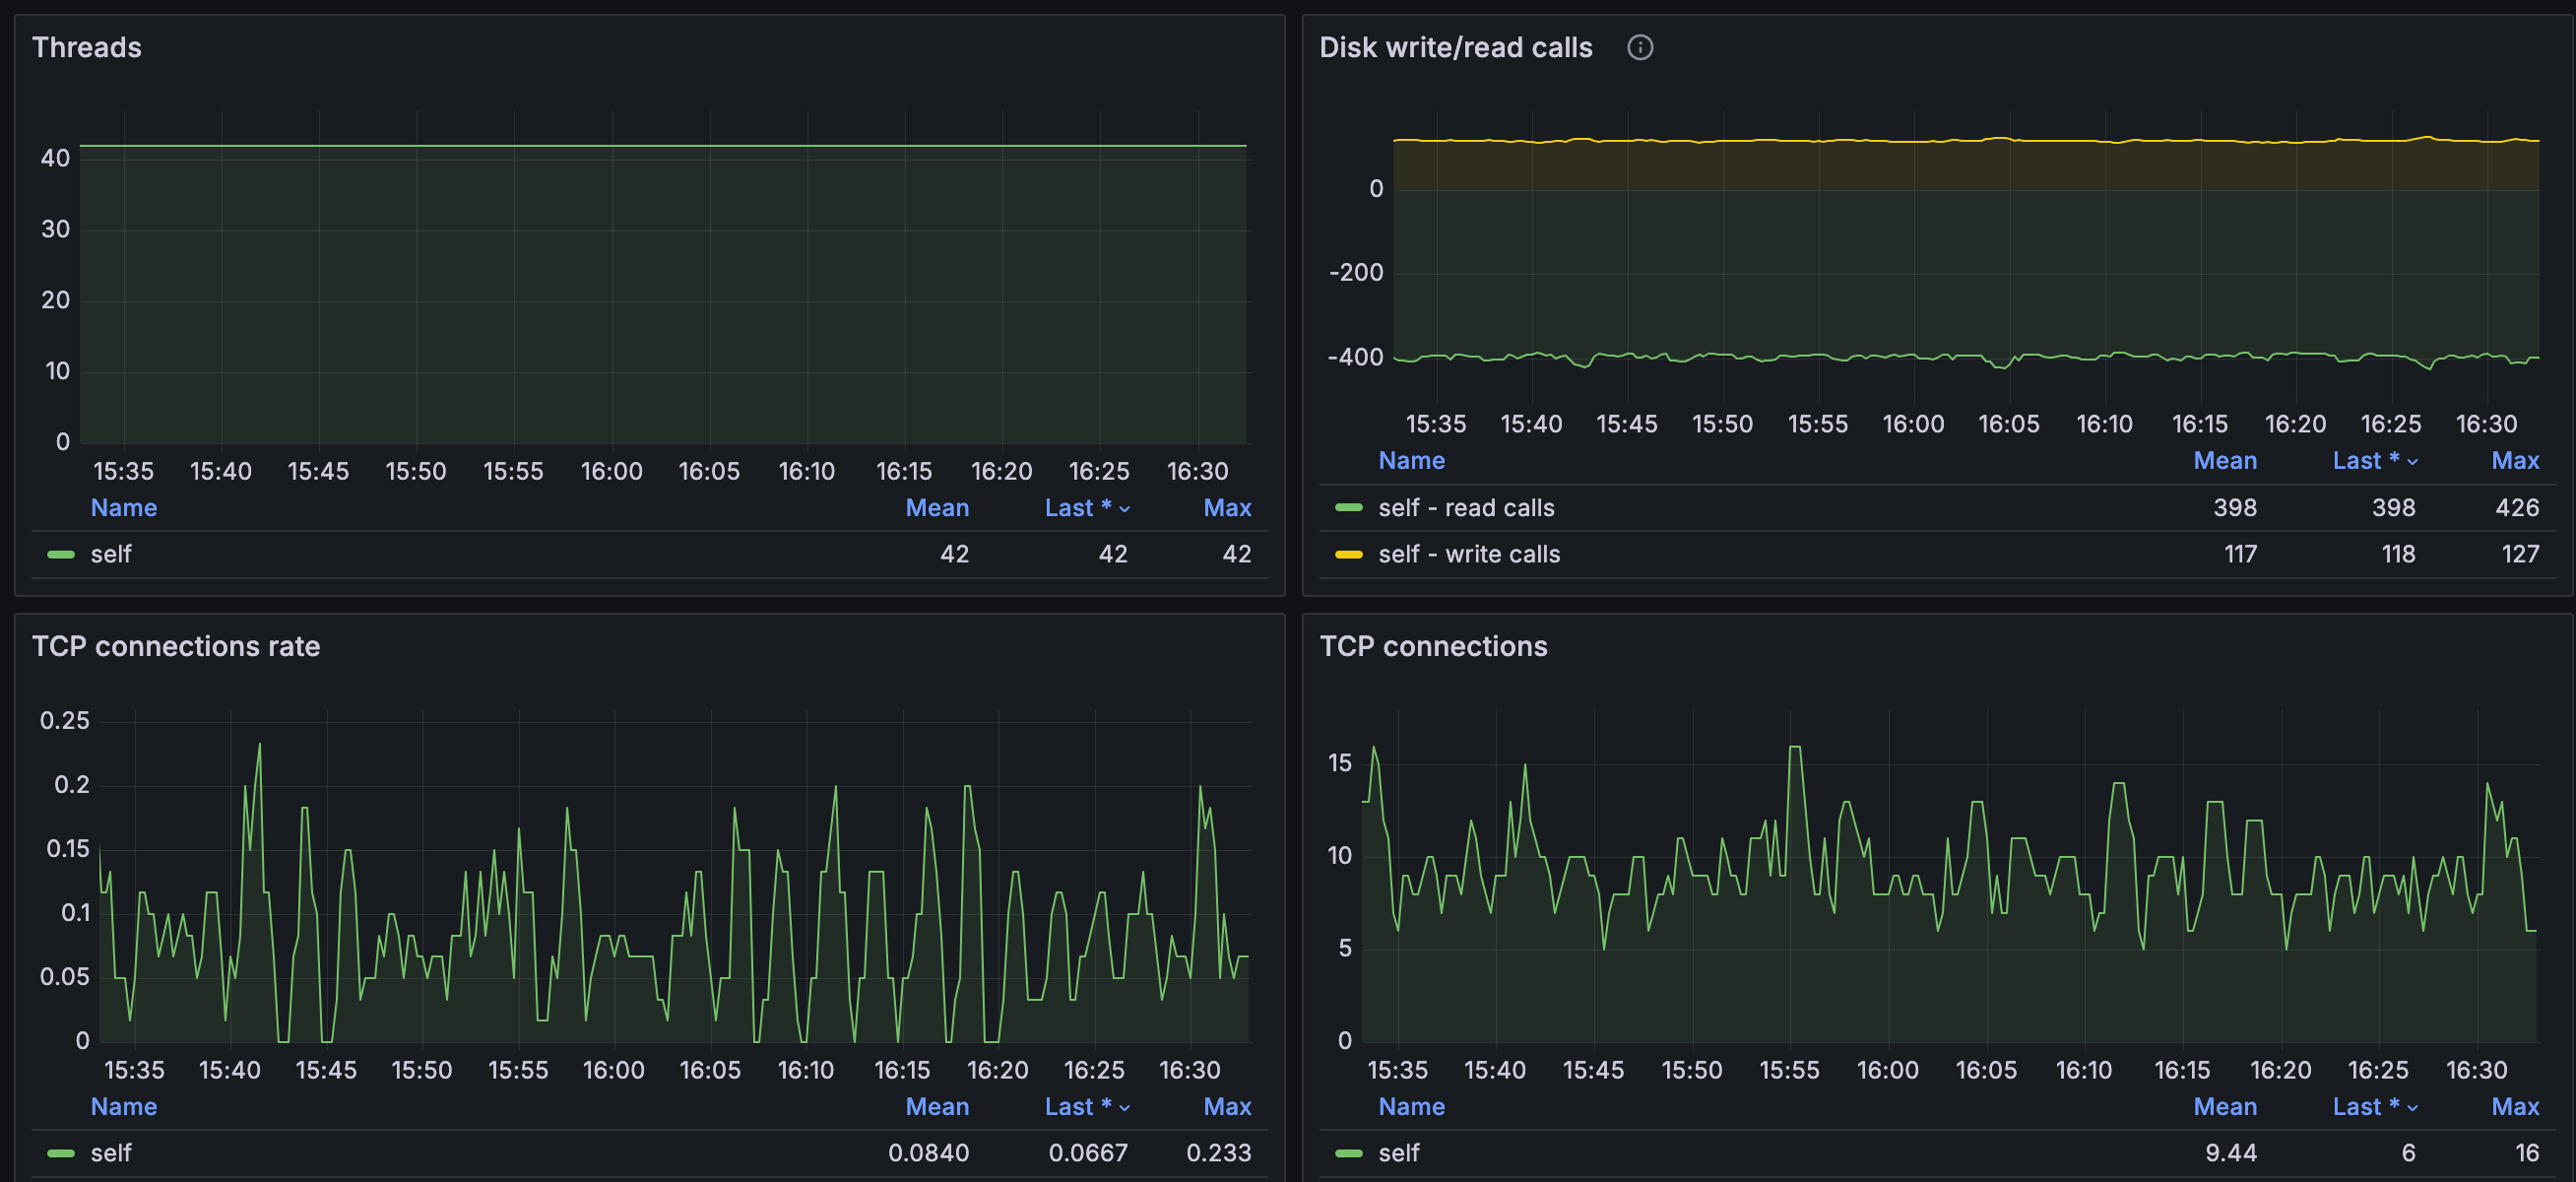
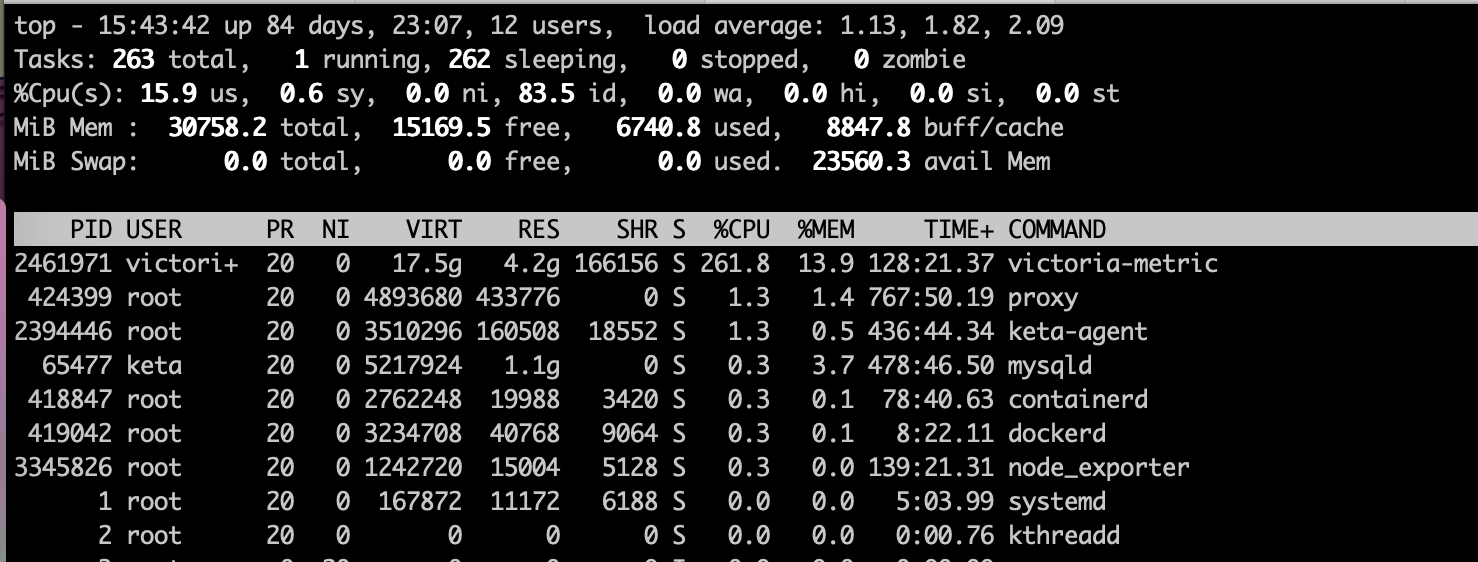
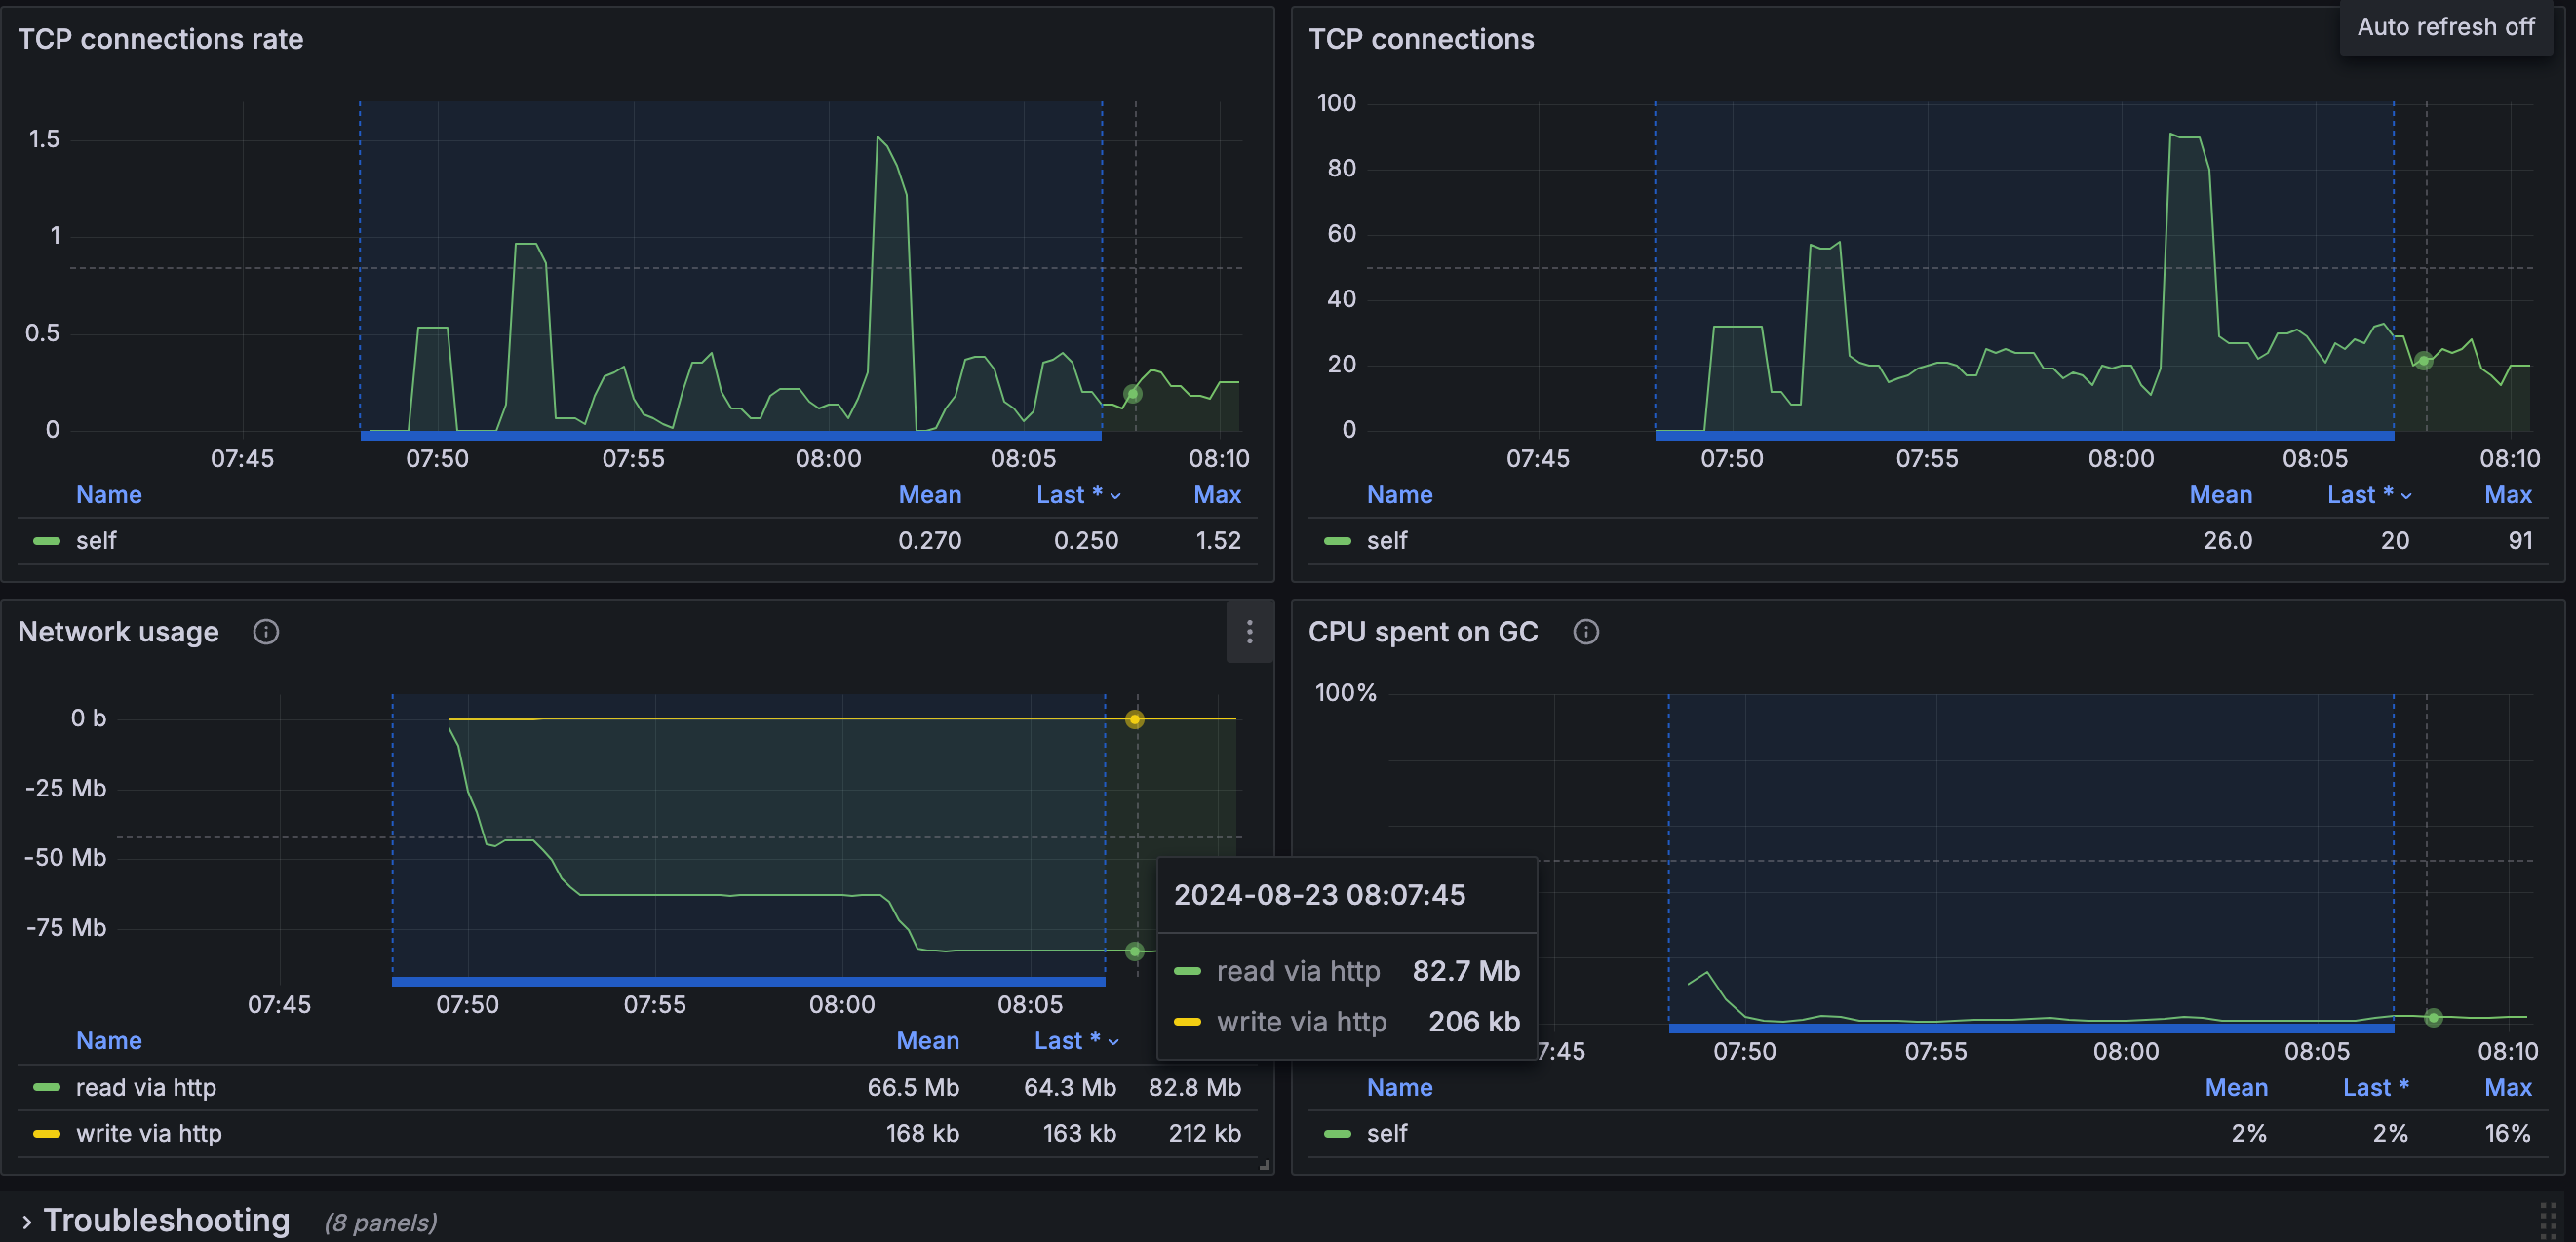
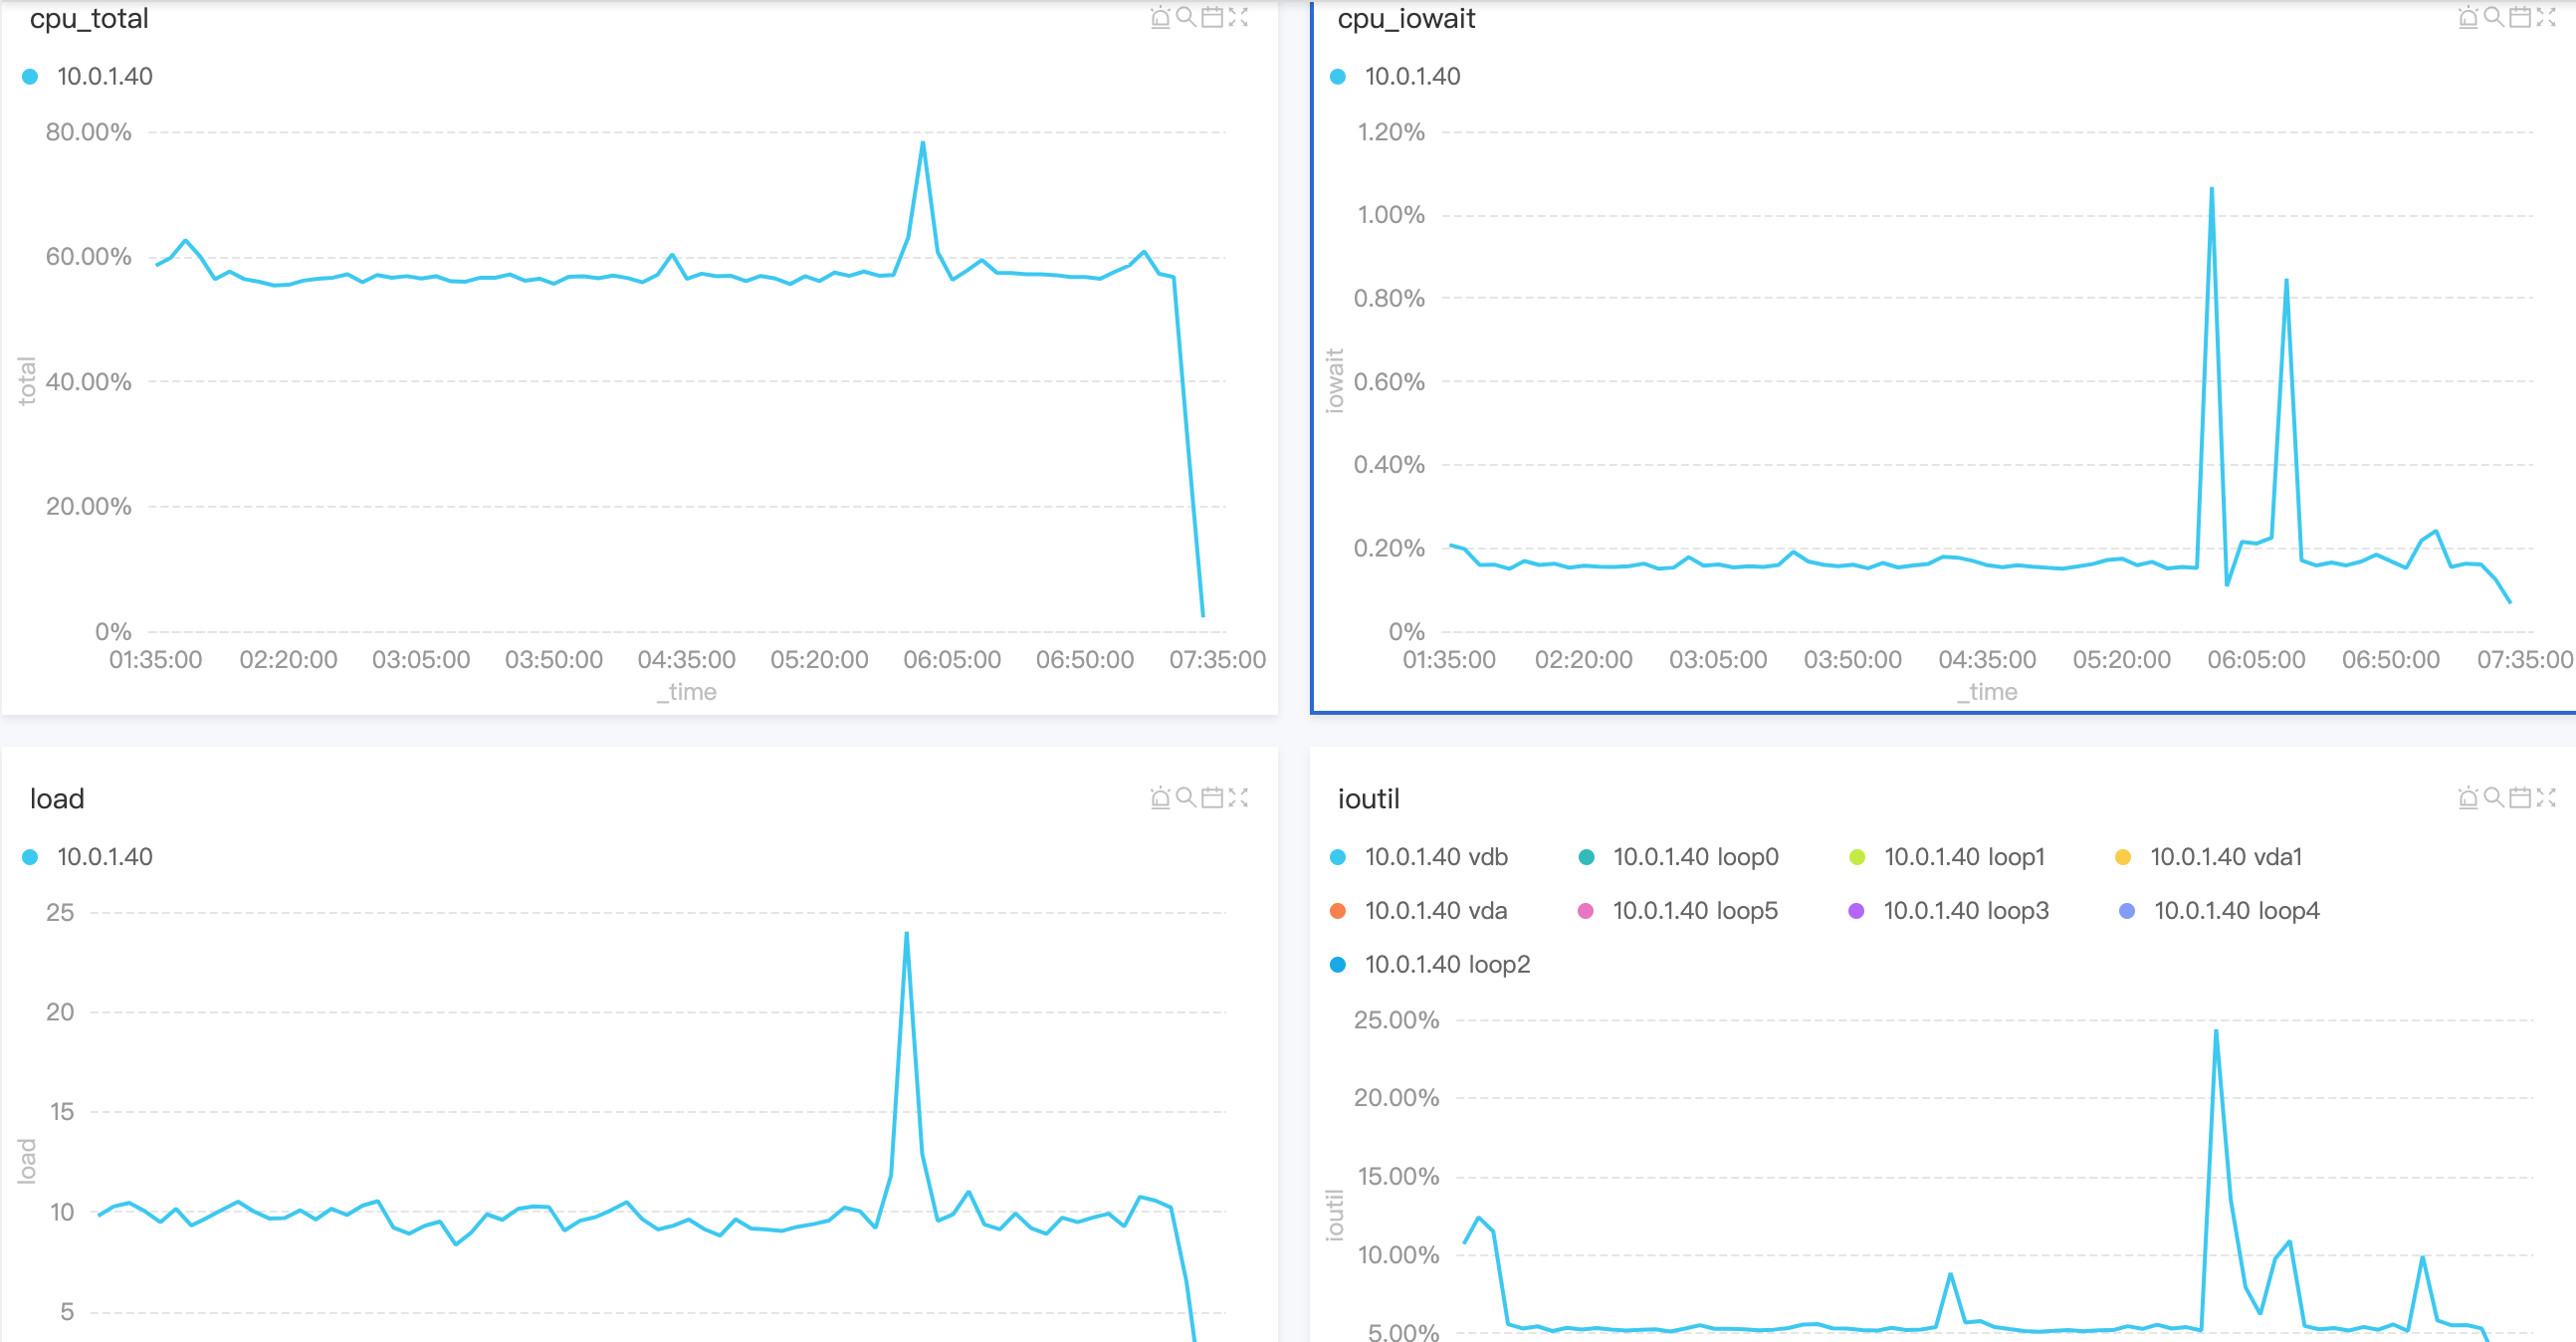
14% 的CPU使用率 CPU 2 (3个并发 23%)

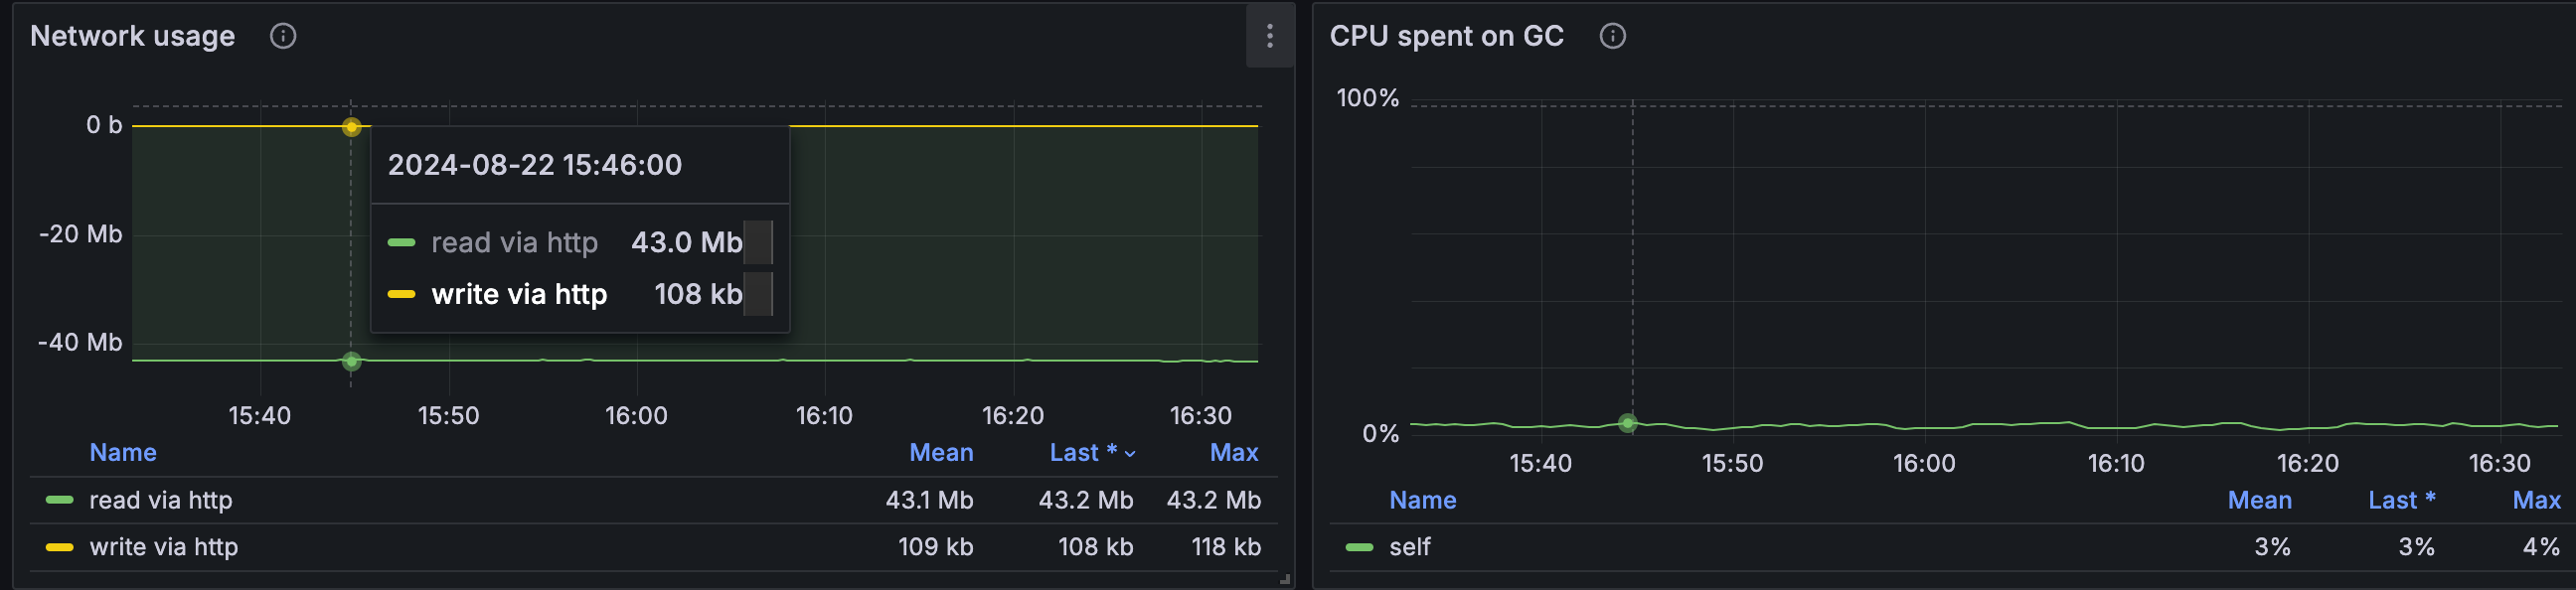
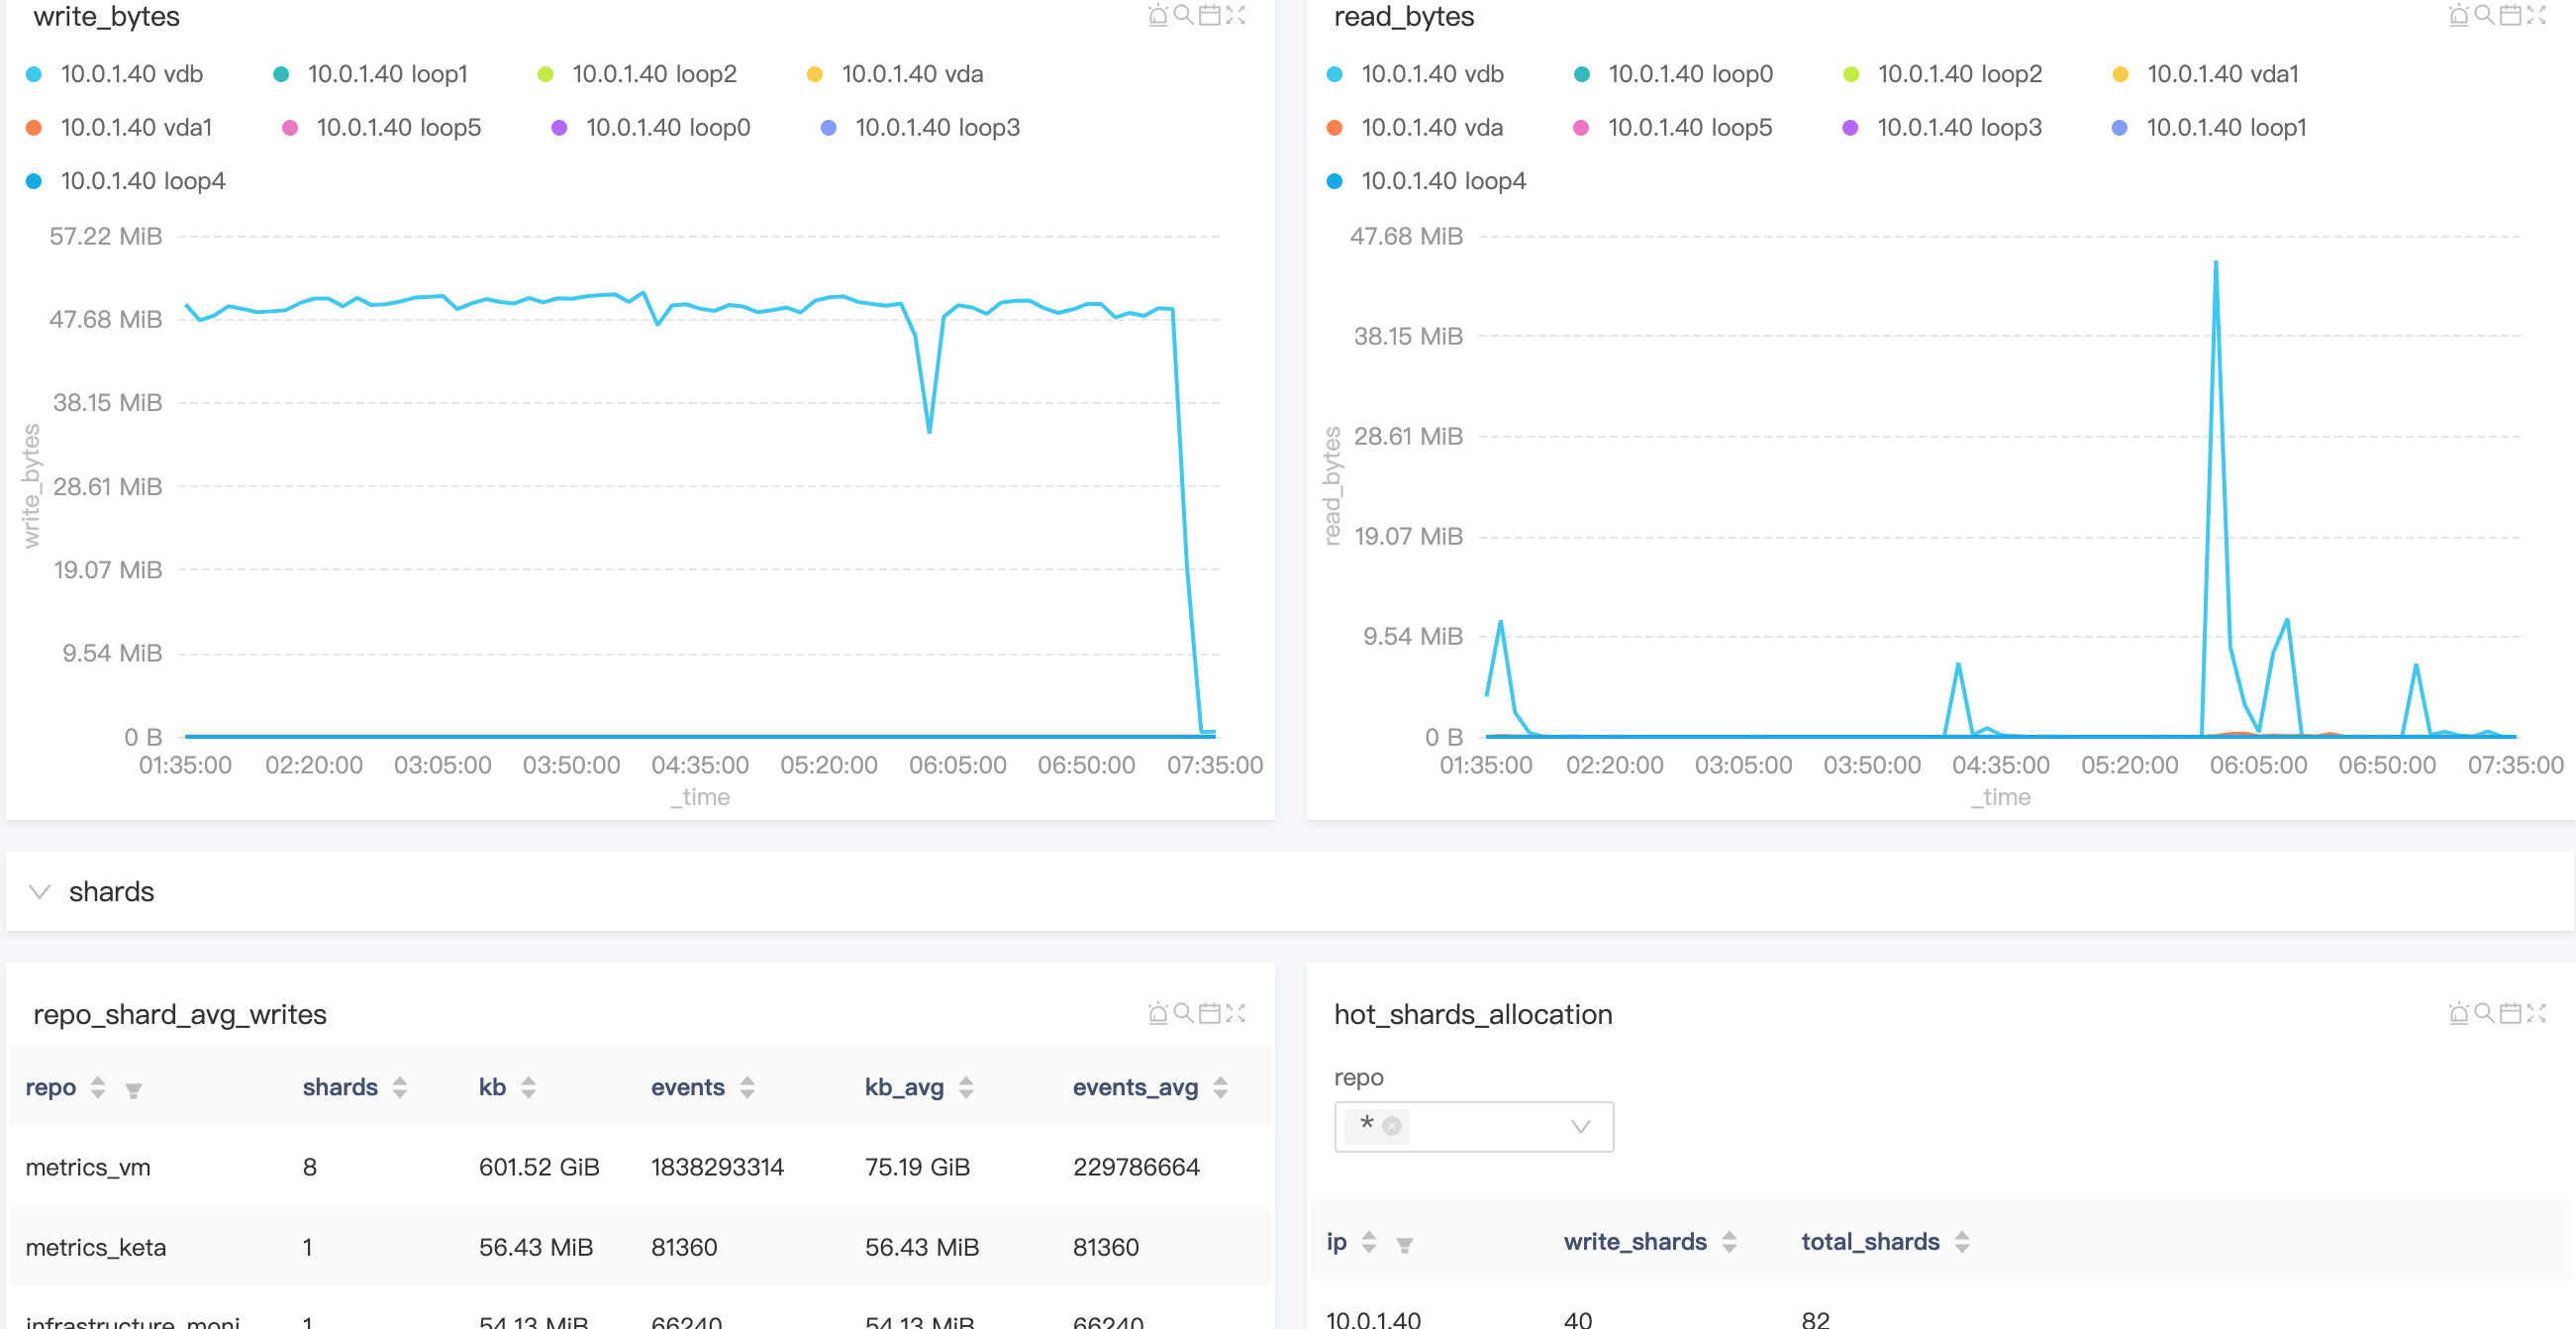
网络 43Mb read( 82Mb) 磁盘写入9mb/s(3并发 16mb/s)
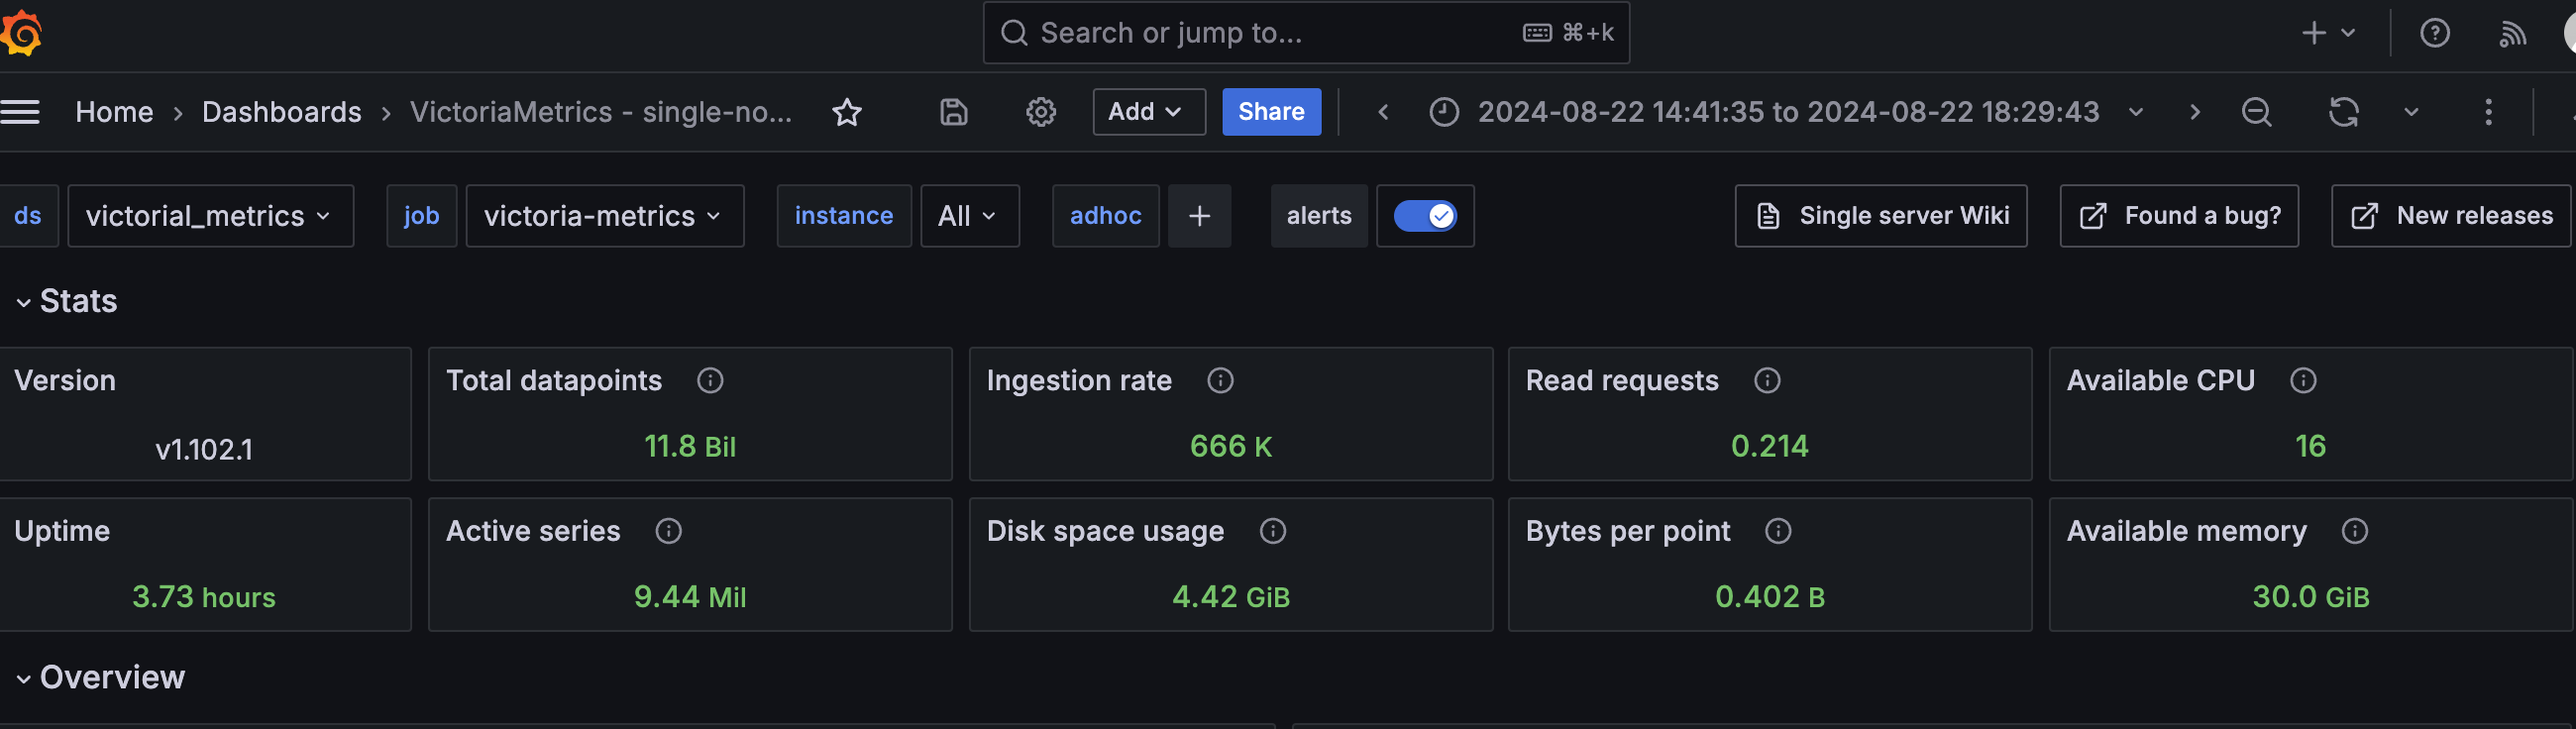
image-20240822185304358

image-20240822184932372

image-20240822163040834

资源使用

image-20240822163155054

image-20240822163309954

image-20240822163353262

image-20240822163407757

image-20240822154412525

三个独立vmagent(3000 targets *3) 同时打数据

写入吞吐到 1.66m/s

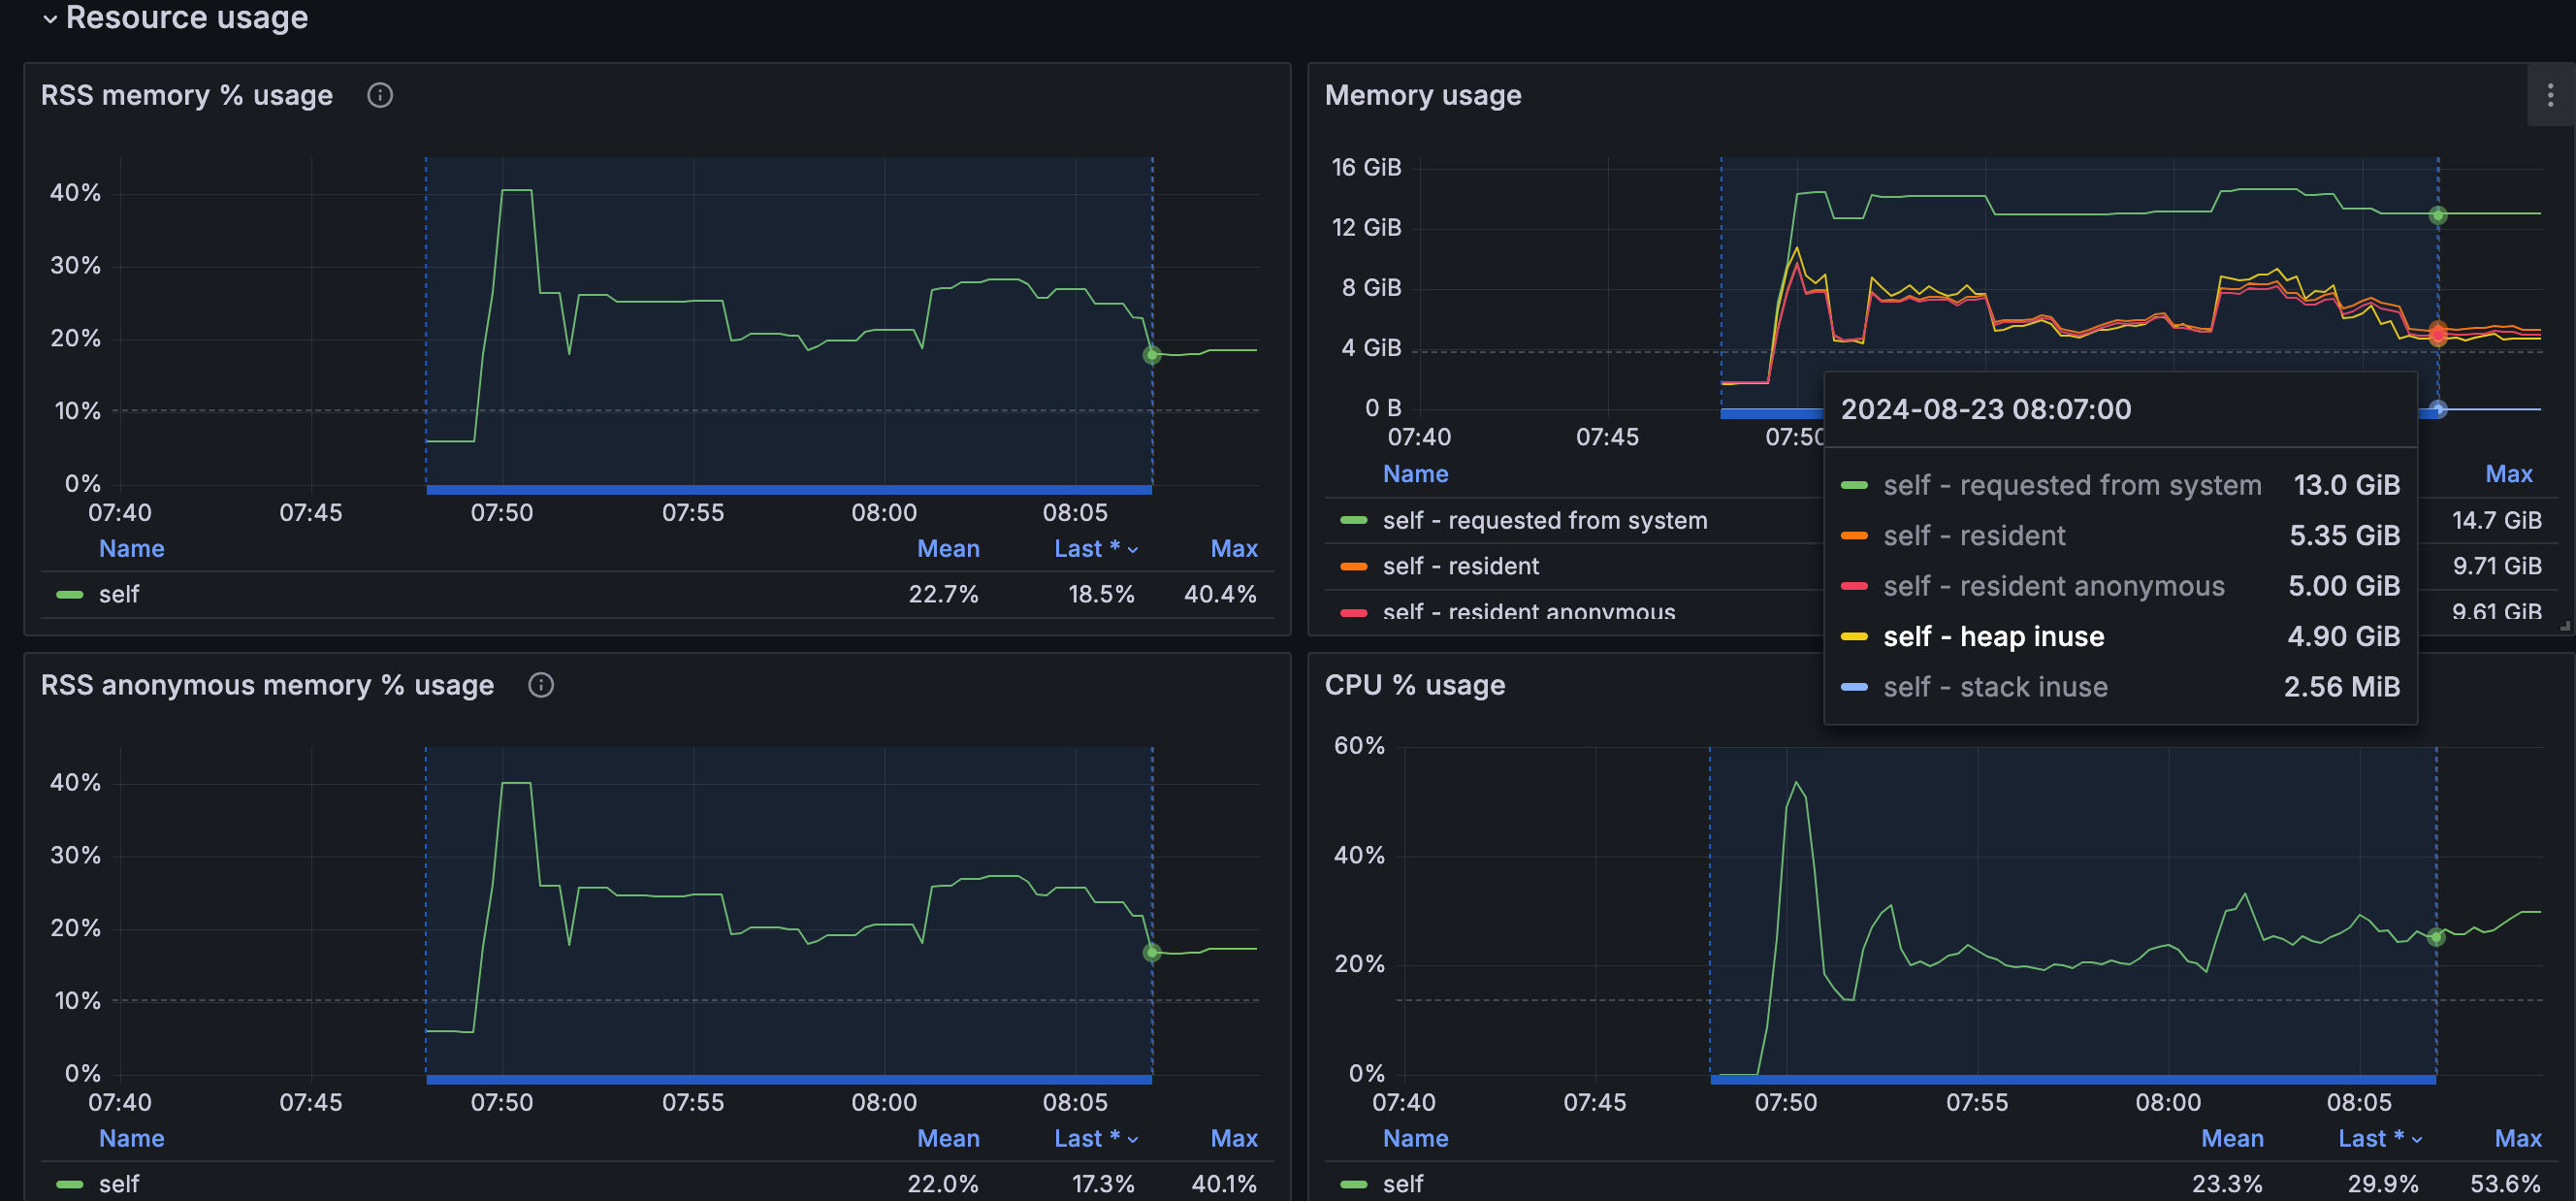
资源使用平稳

(三级跳现象: 陆续启动3个打数的agent)
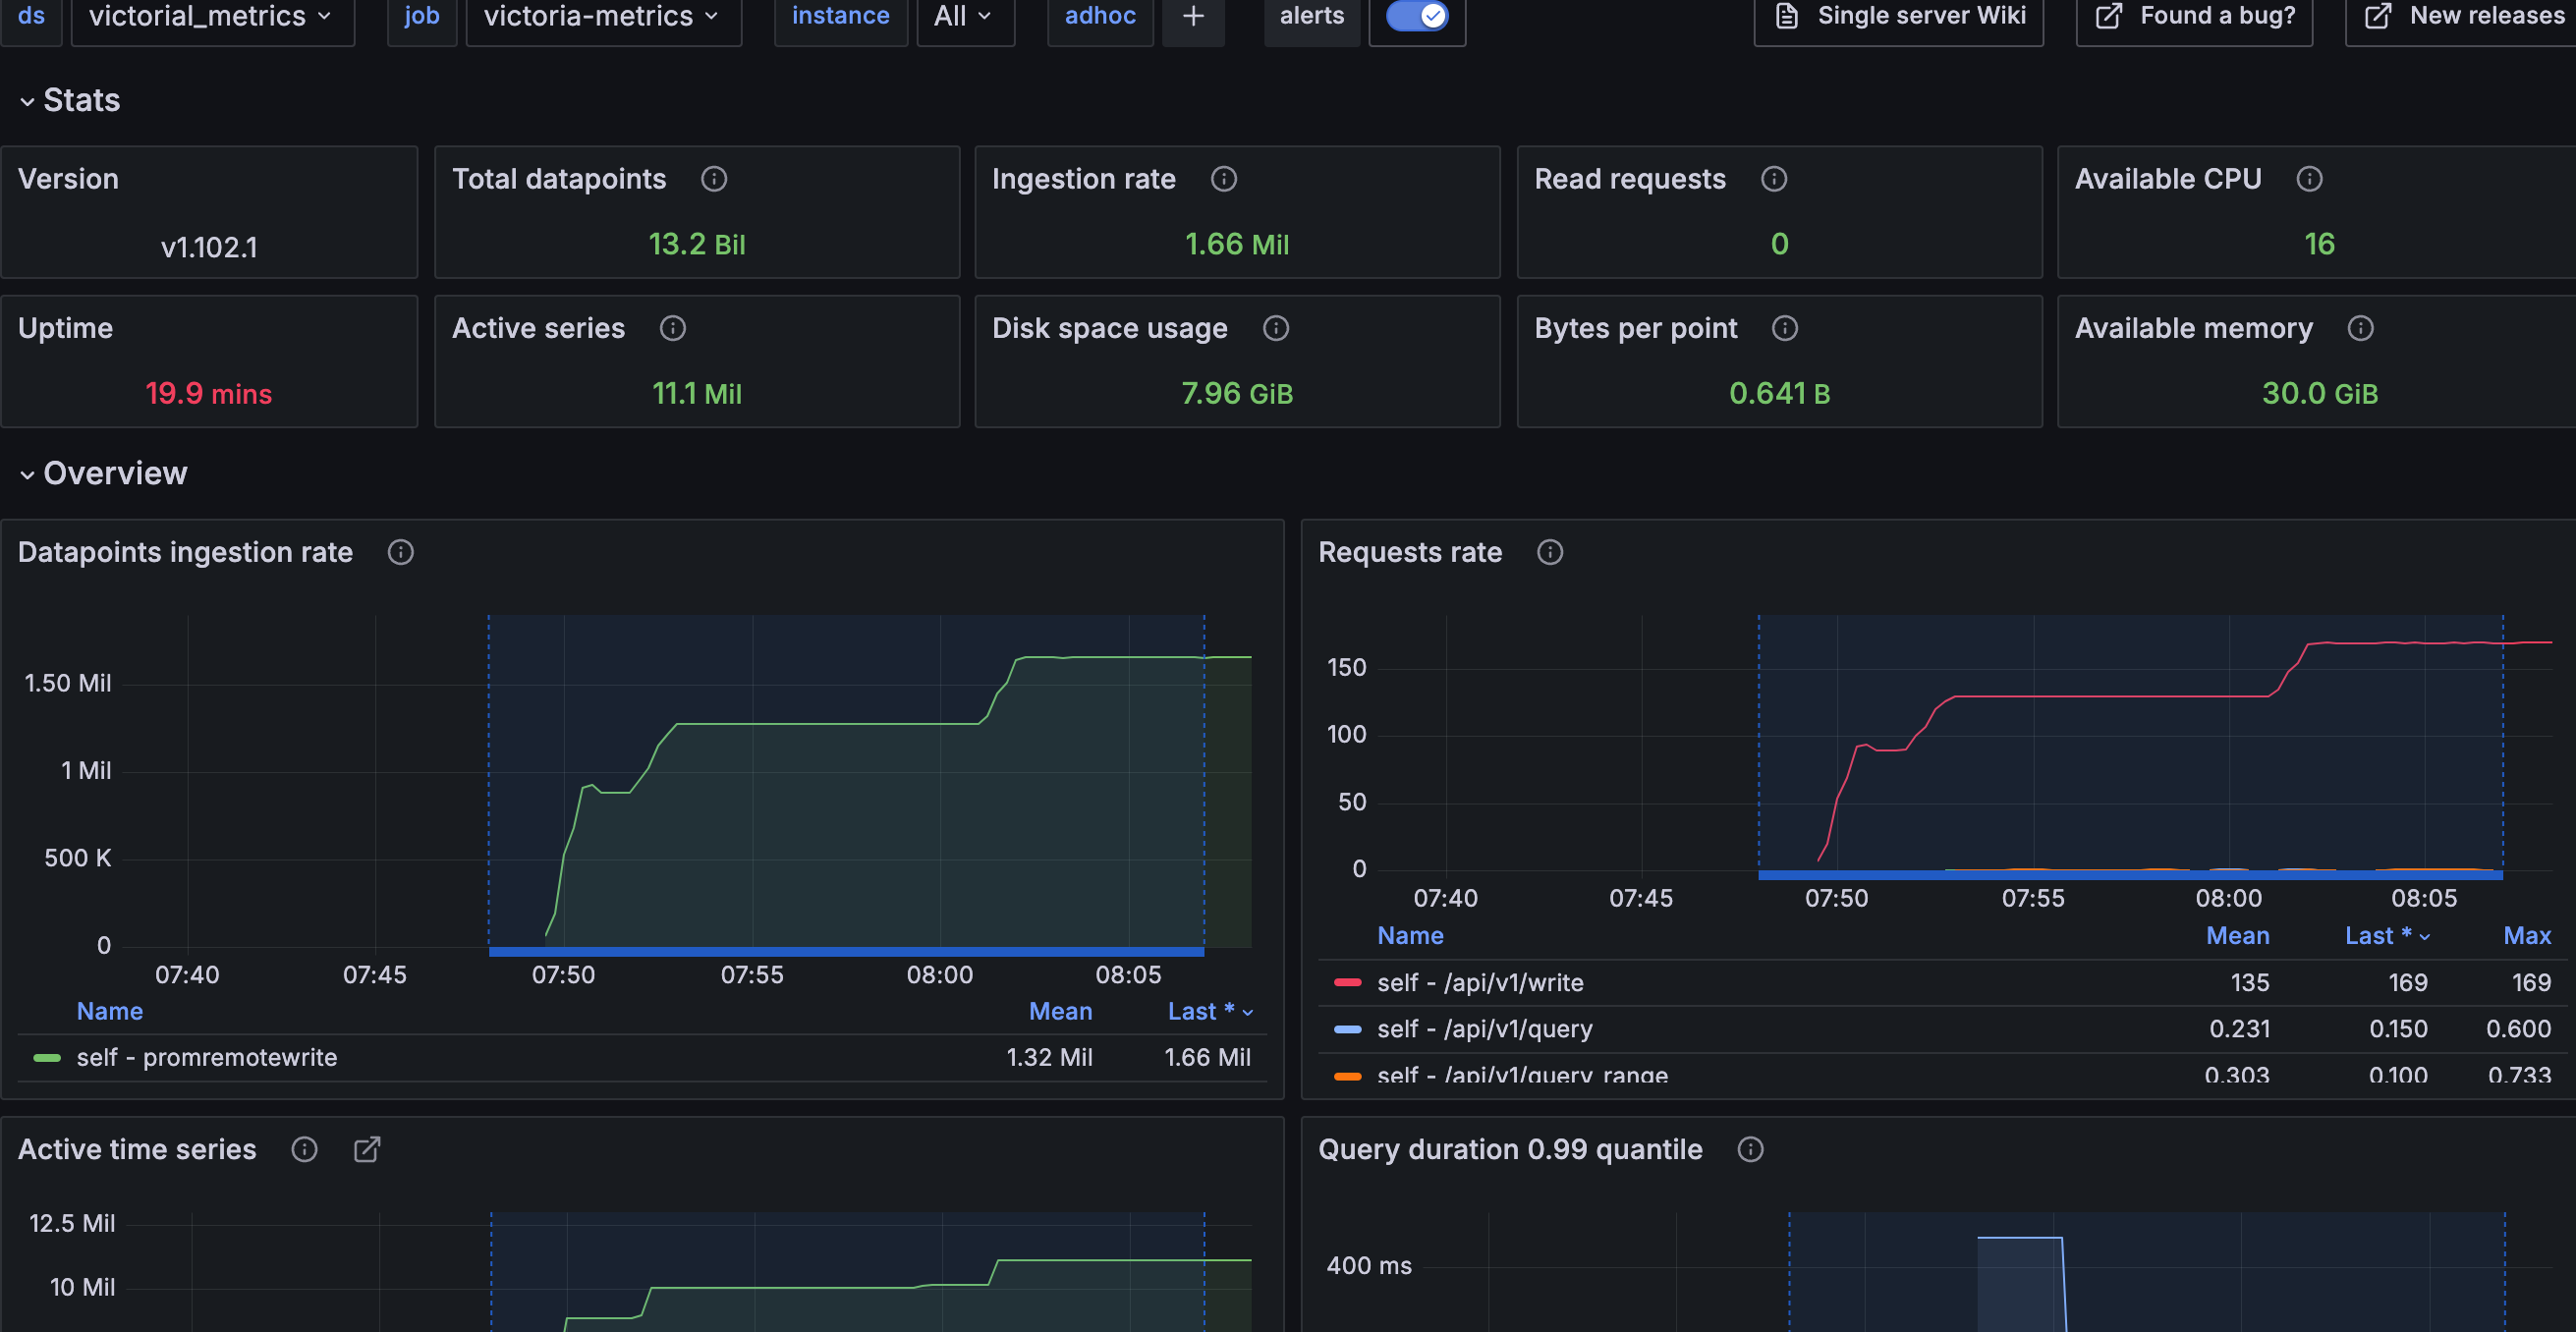
image-20240823080938079

内存在 agent初始接入时会有大幅上升,1分钟左右降下来后就比较平稳

image-20240823081022830

image-20240823081107330

Ketaops

23:00 ~ 07:28 26.7亿 52.5G

写时并发度 8 仓库副本1 写时副本1 仓库分片1亿/20Gb

image-20240822225616498

image-20240823102347637

压缩率

1
2
3
4
5
6
7
8
metric_repo   979223709 9.8亿 12.6G
prometheus_jsonl 8842910 884万 1.86G (10s)
json压缩率: 12.6 /(979223709/8842910 * 1.86) = 0.06117456442322286 6.1%


metric_repo 2665259314 26.7亿 52.5G
prometheus_jsonl 8842910 884万 1.86G (10s)
json压缩率: 52.5/(2665259314/8842910 * 1.86) = 0.09364877361761739 9.3%

agent 给数据打了 host_ip host 两个tag,会一定程度增加最终数据量的大小。

由于两个tag只有单一值,并且是基于字典压缩,降低了影响,不进行重新压测

写入吞吐

87K/s

磁盘写入 47.7Mb/s

资源消耗

cpu 60%

内存 18Gb

监听指标截图

存在摄入延迟、所以没有加大并发 来测试写入吞吐了

vmagent 端的待处理数据量,尚未发送到远程存储。如果图表增长,则远程存储无法跟上给定的数据摄取率。 一直存在,但是没有上升
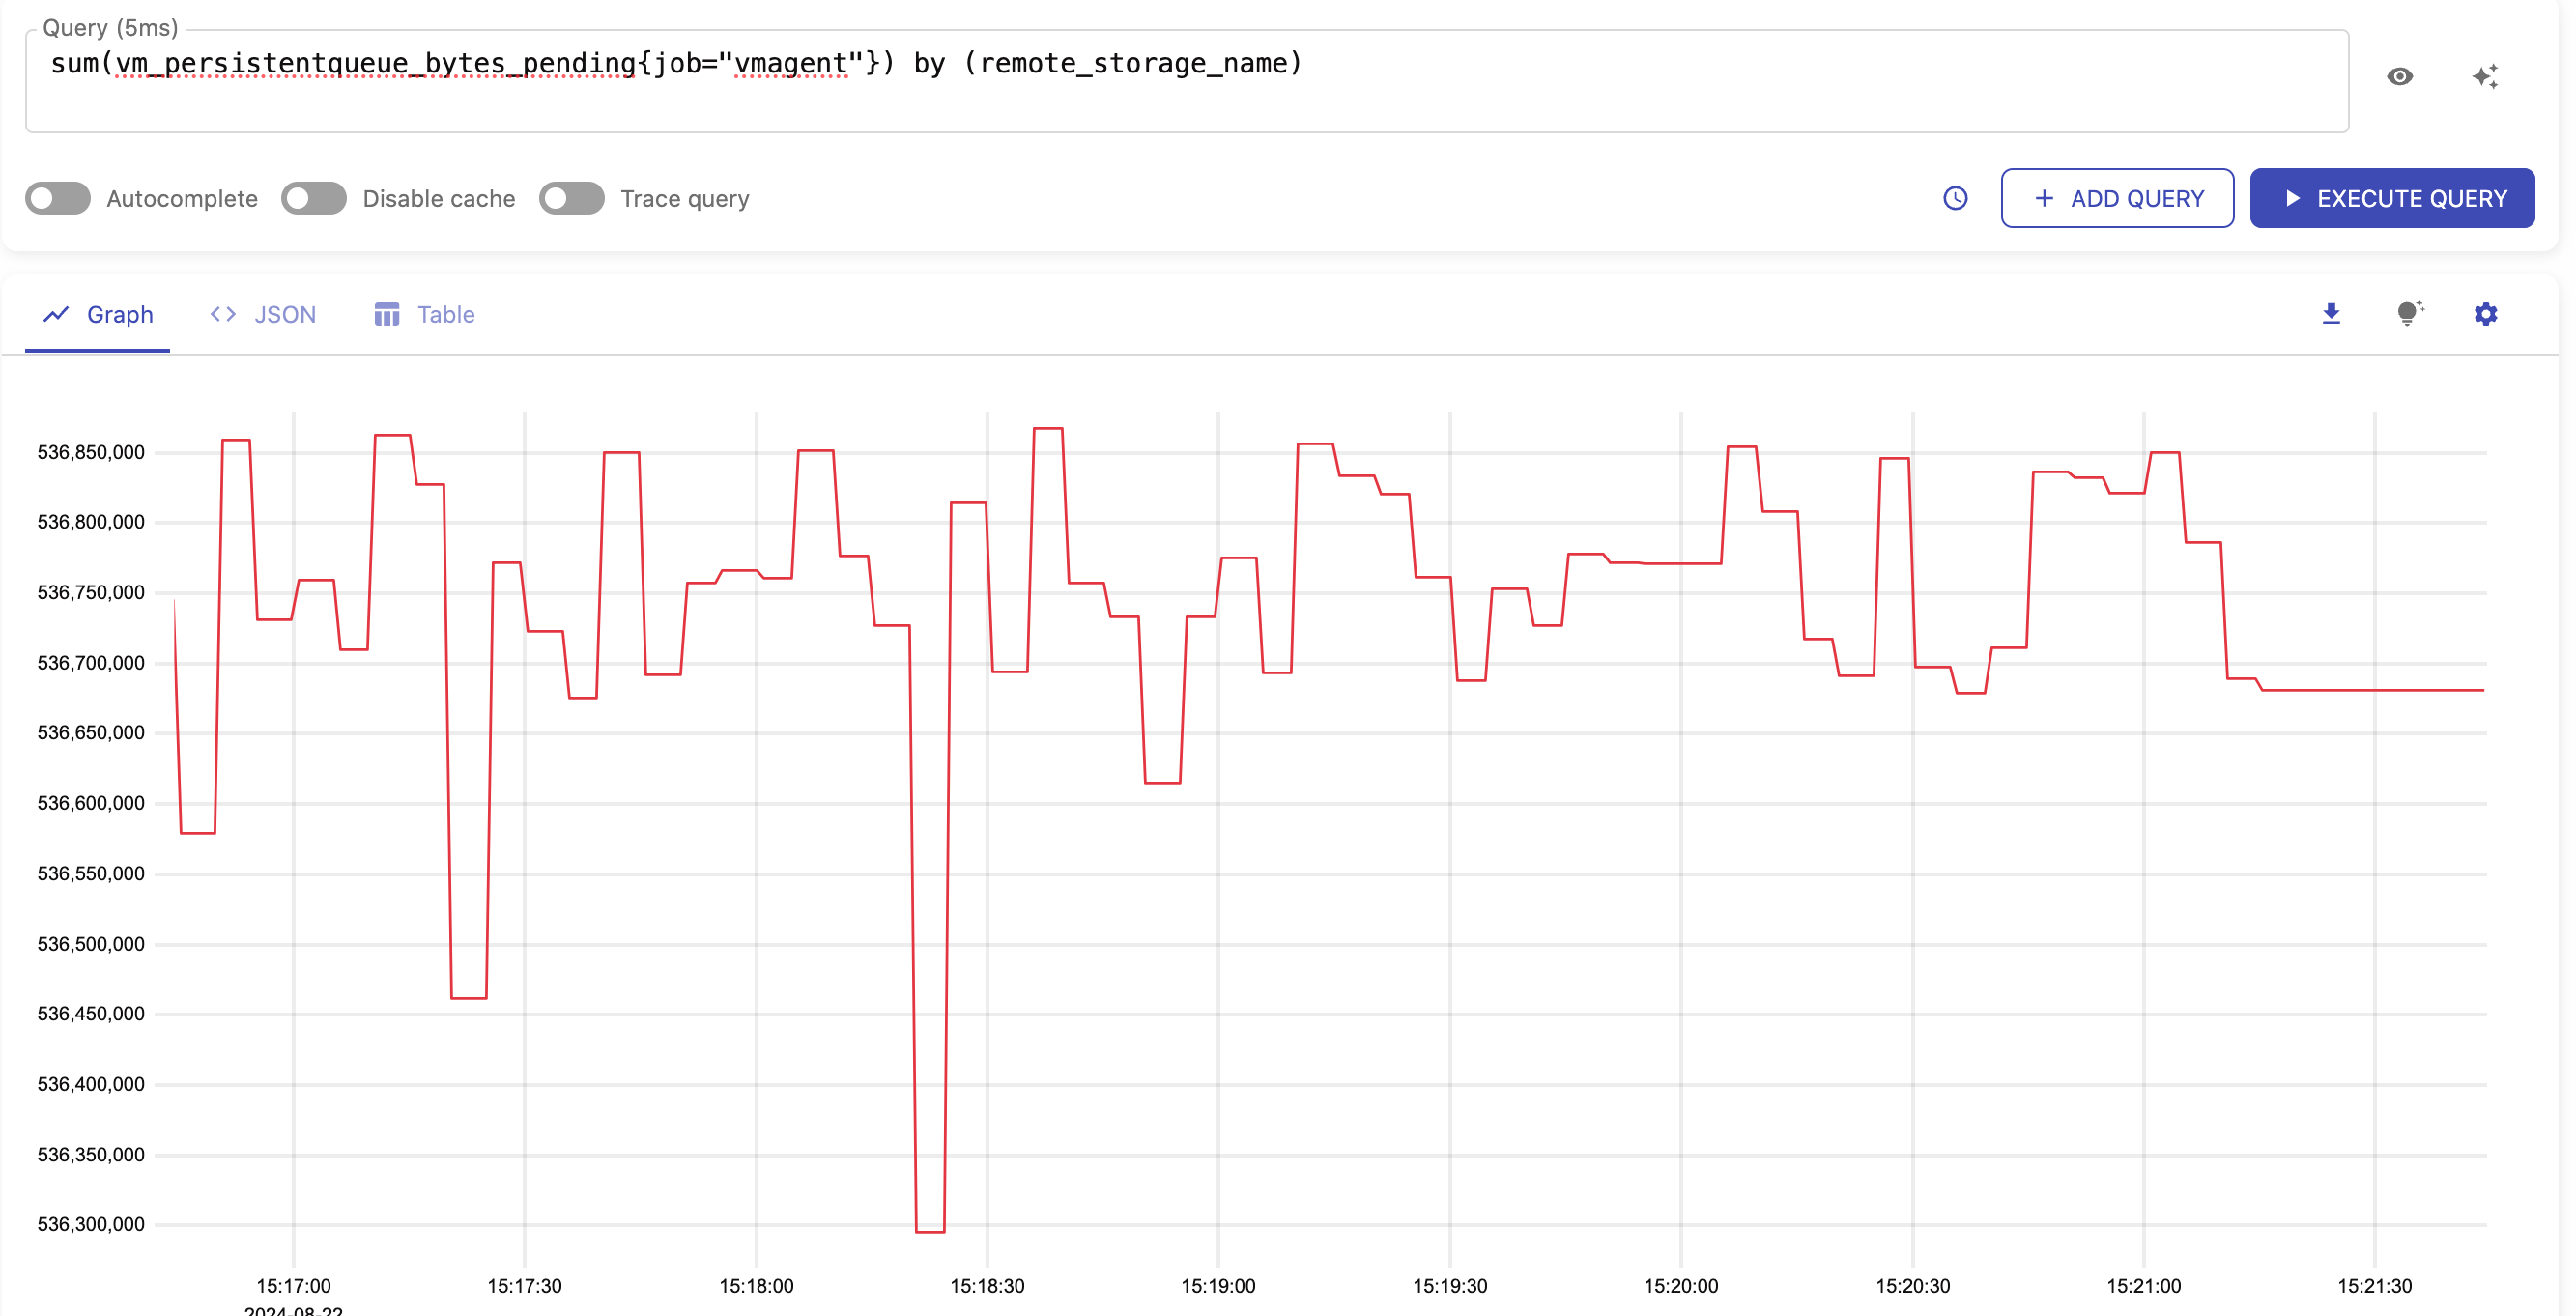
image-20240822232213141

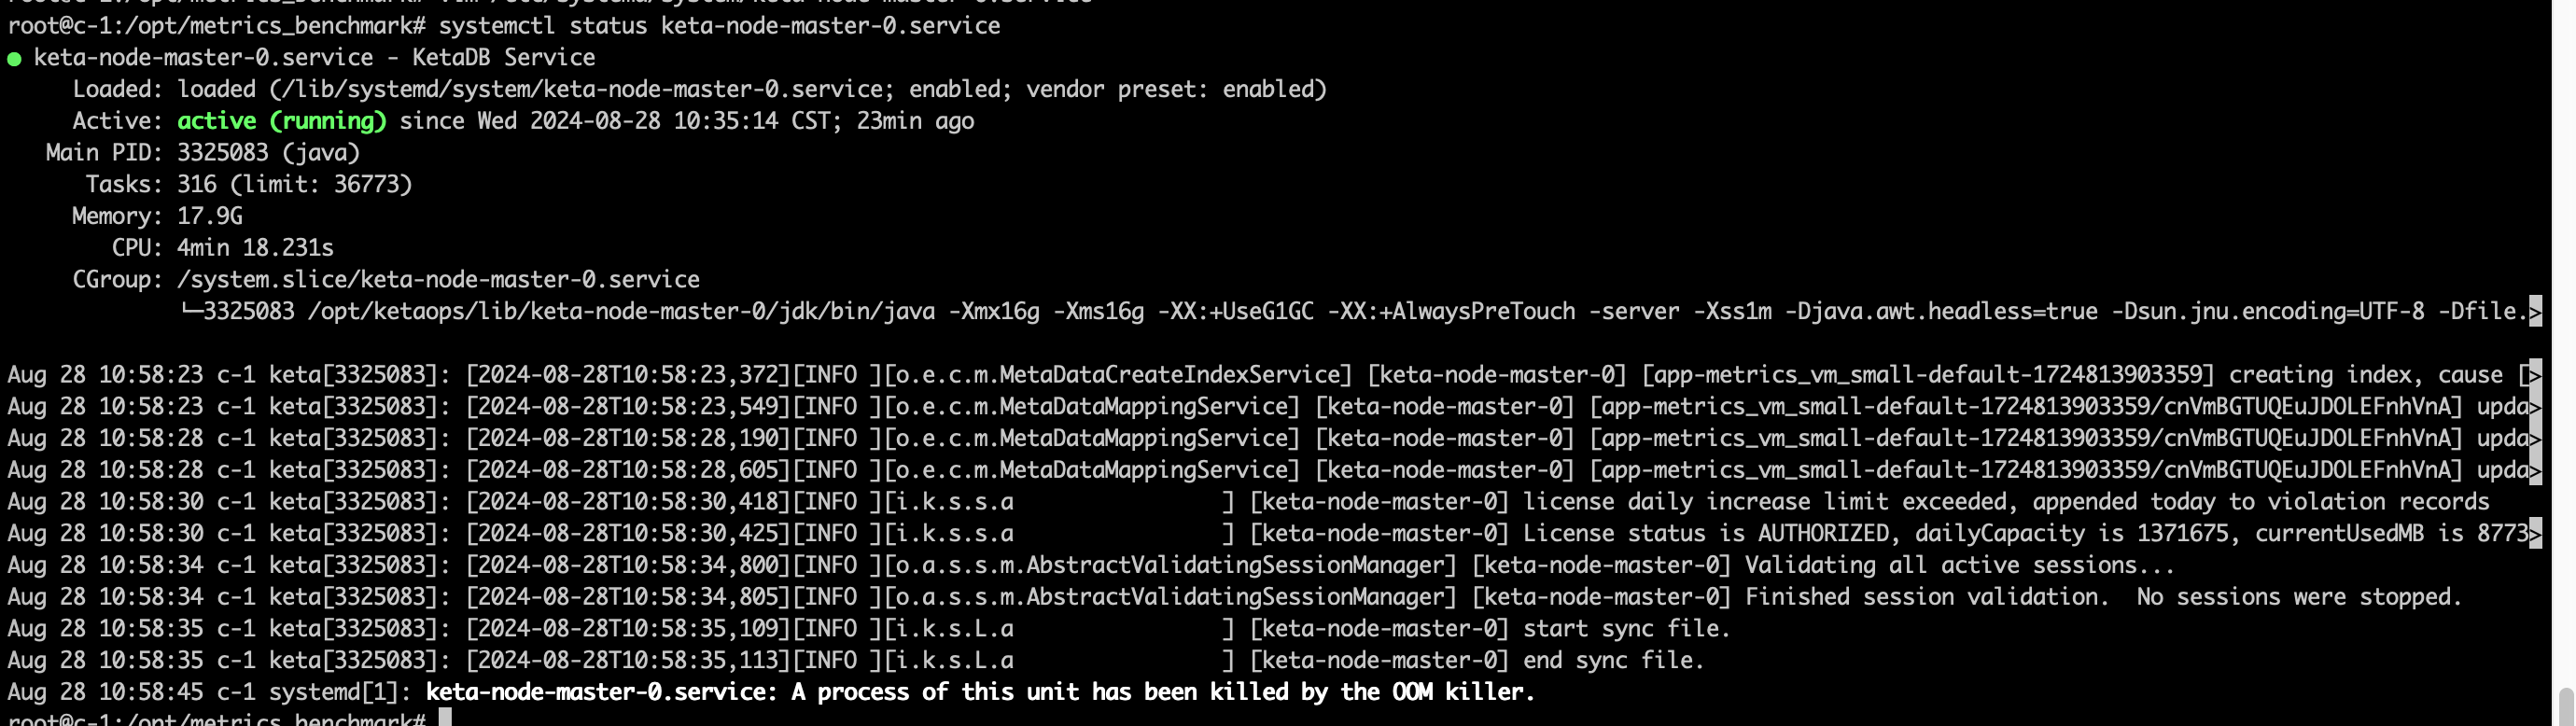
ketaserver oom

image-20240828105936655

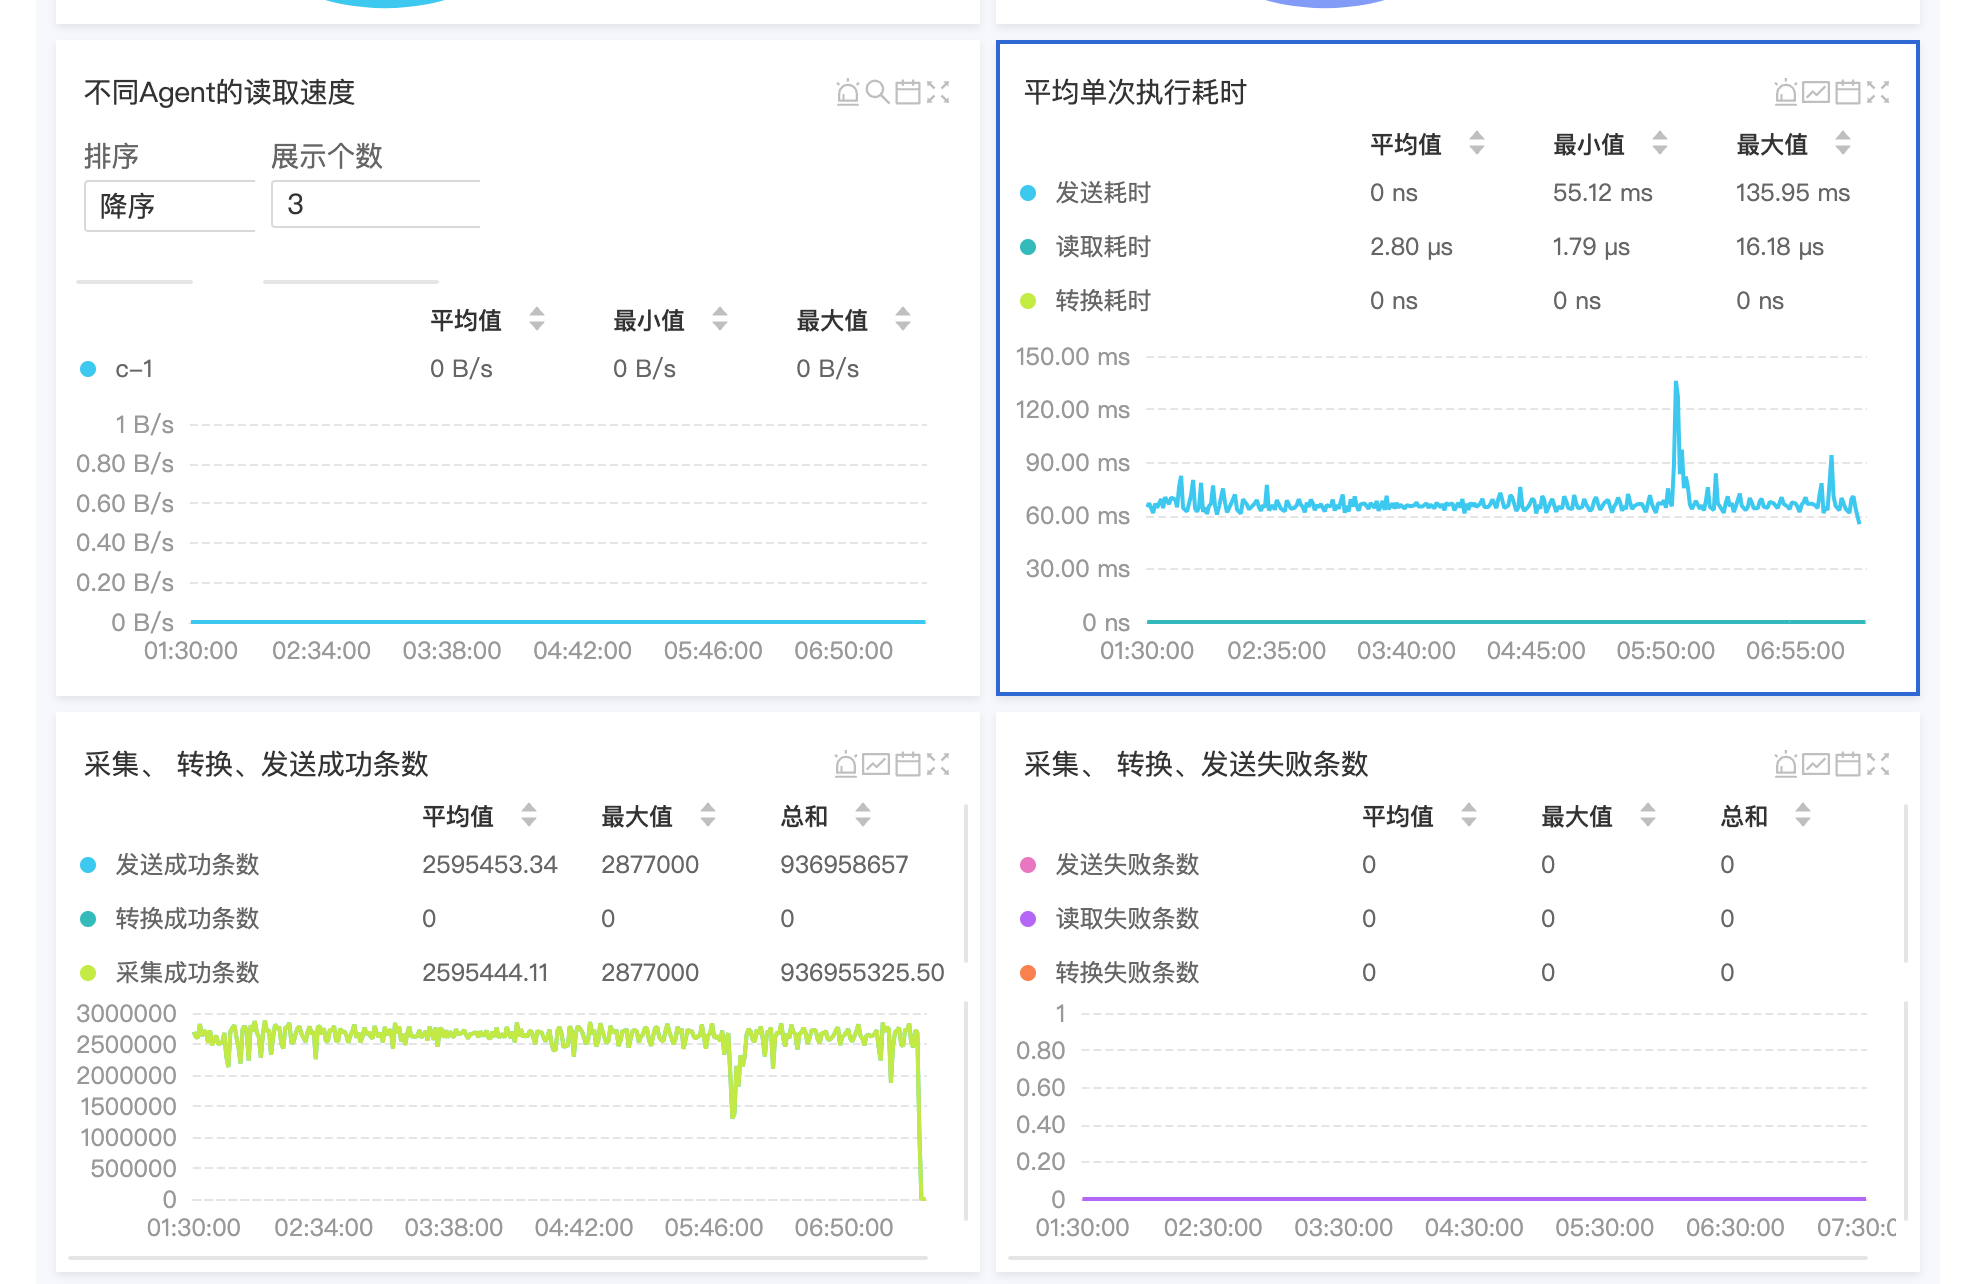
Agent采集任务监听看板

image-20240823073039448

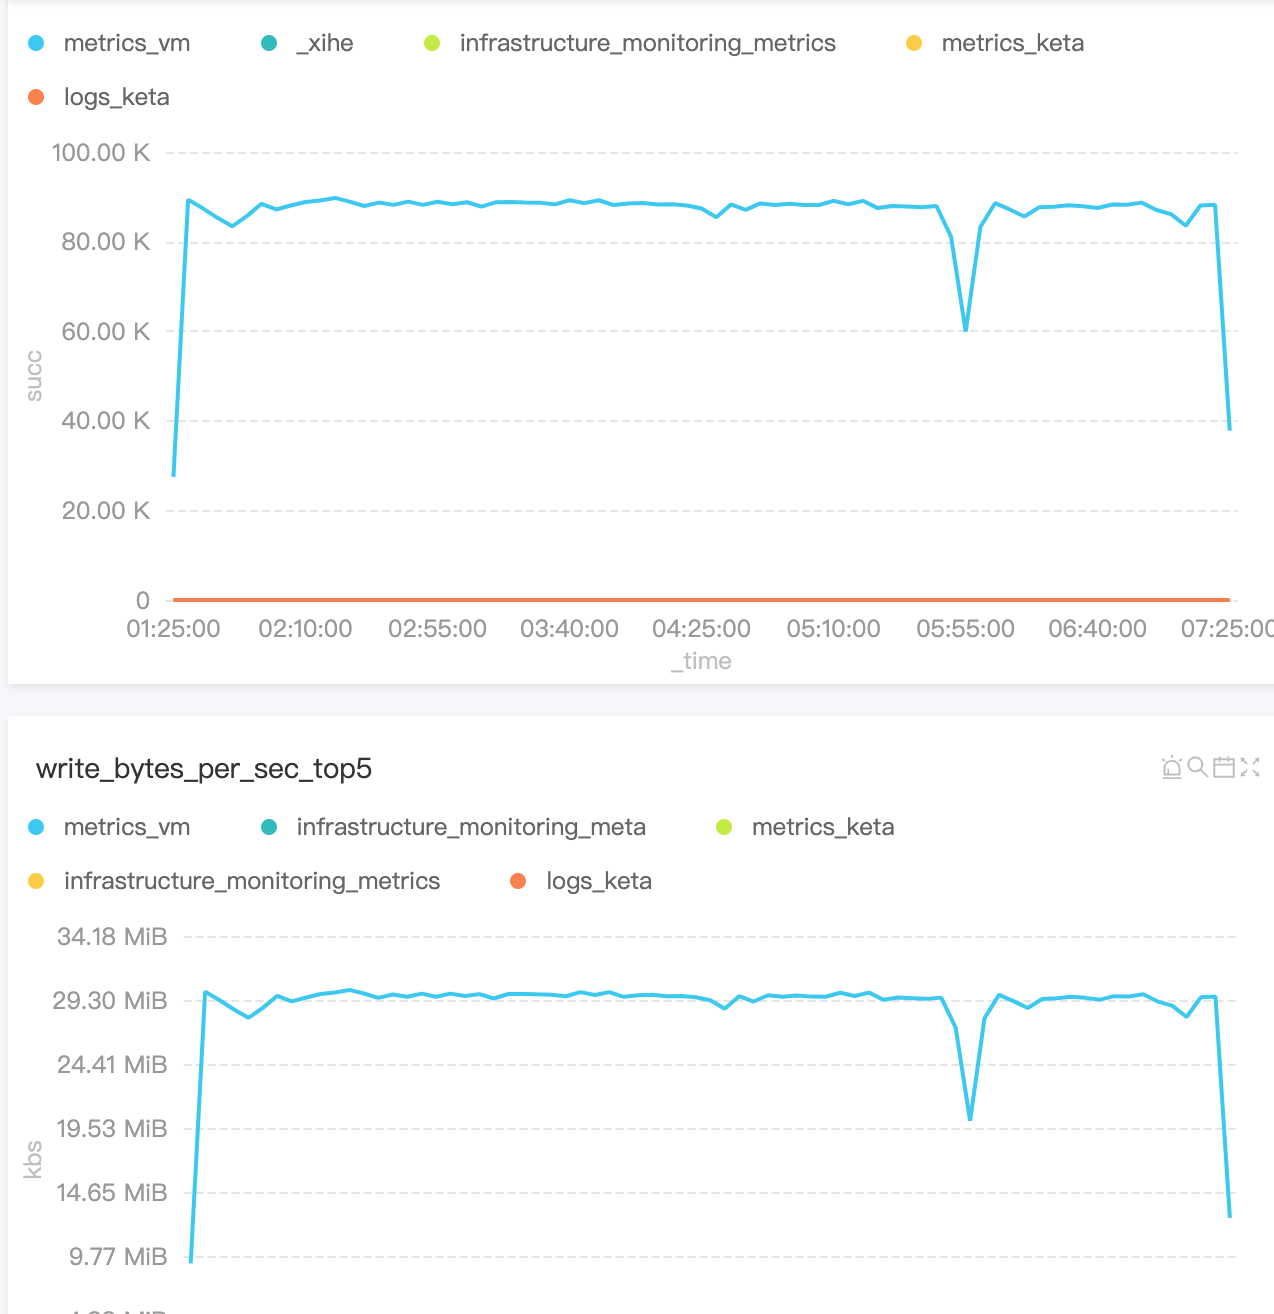
摄入速率

image-20240823073132385

资源消耗

image-20240823073606801 image-20240823073655871

Comments

Your browser is out-of-date!

Update your browser to view this website correctly. Update my browser now

×