现象:访问产品间歇性出现TimeOut
现象:访问其他网站正常,但是只要是访问公司的产品网站有时就会非常缓慢,有时候会出现504 网关超时。 这种现象也是间歇性发生
收集基础信息
所有产品对外的nginx 出口机是10.9.171.123,外网IP是123.59.83.77
以下以:www.clickhouse.com.cn (clickhouse也是配置在ucloud 上) 为例进行分析:
1 | curl www.clickhouse.com.cn -o /dev/null |
分析请求过程中各个阶段所耗时间
vim curl-format.txt,输入:
1 | time_namelookup: %{time_namelookup}\n |
走内网地址:
1 | curl -w "@curl-format.txt" -o /dev/null -s -L "http://www.clickhouse.com.cn" -x 10.9.171.123:80 |
得到结果分析
1 | time_namelookup: 0.004169 |
- DNS 查询: 4.1ms
- TCP 连接时间:pretransfter(39) - namelookup(4) = 35ms
- SSL 处理时间(https):time_appconnect - time_connect
- 重定向时间: starttransfer - time_pretransfer
- 服务器处理时间:starttransfter(291) - pretransfer(39) = 252ms
- 内容传输时间:total(397) - starttransfer(291) = 106ms
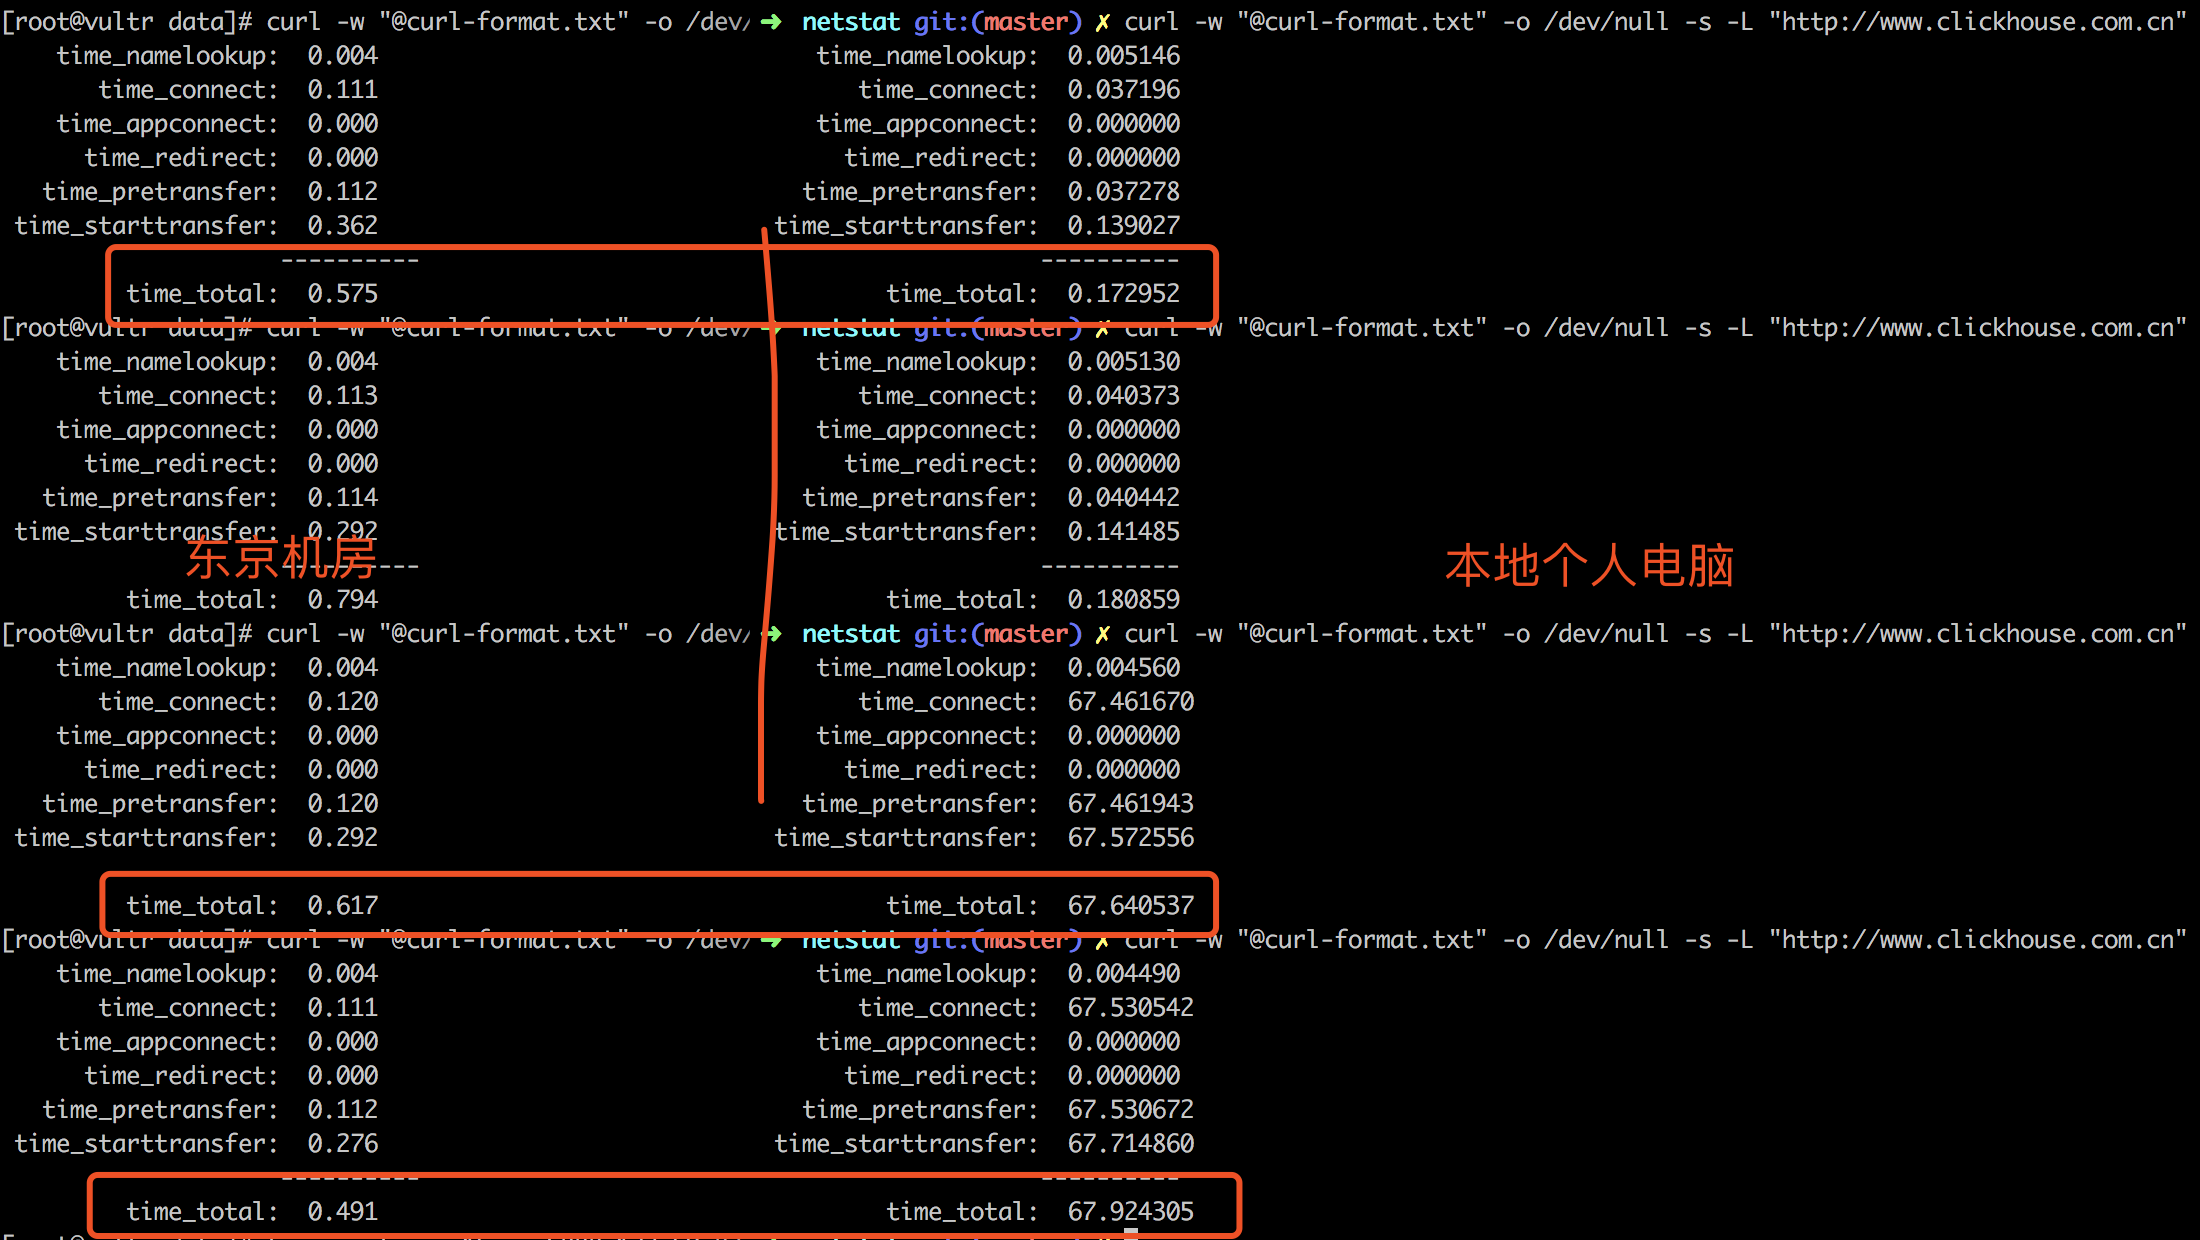
走外网地址:
1 | curl -w "@curl-format.txt" -o /dev/null -s -L "http://www.clickhouse.com.cn" |
结果分析:
1 | time_namelookup: 0.004177 |
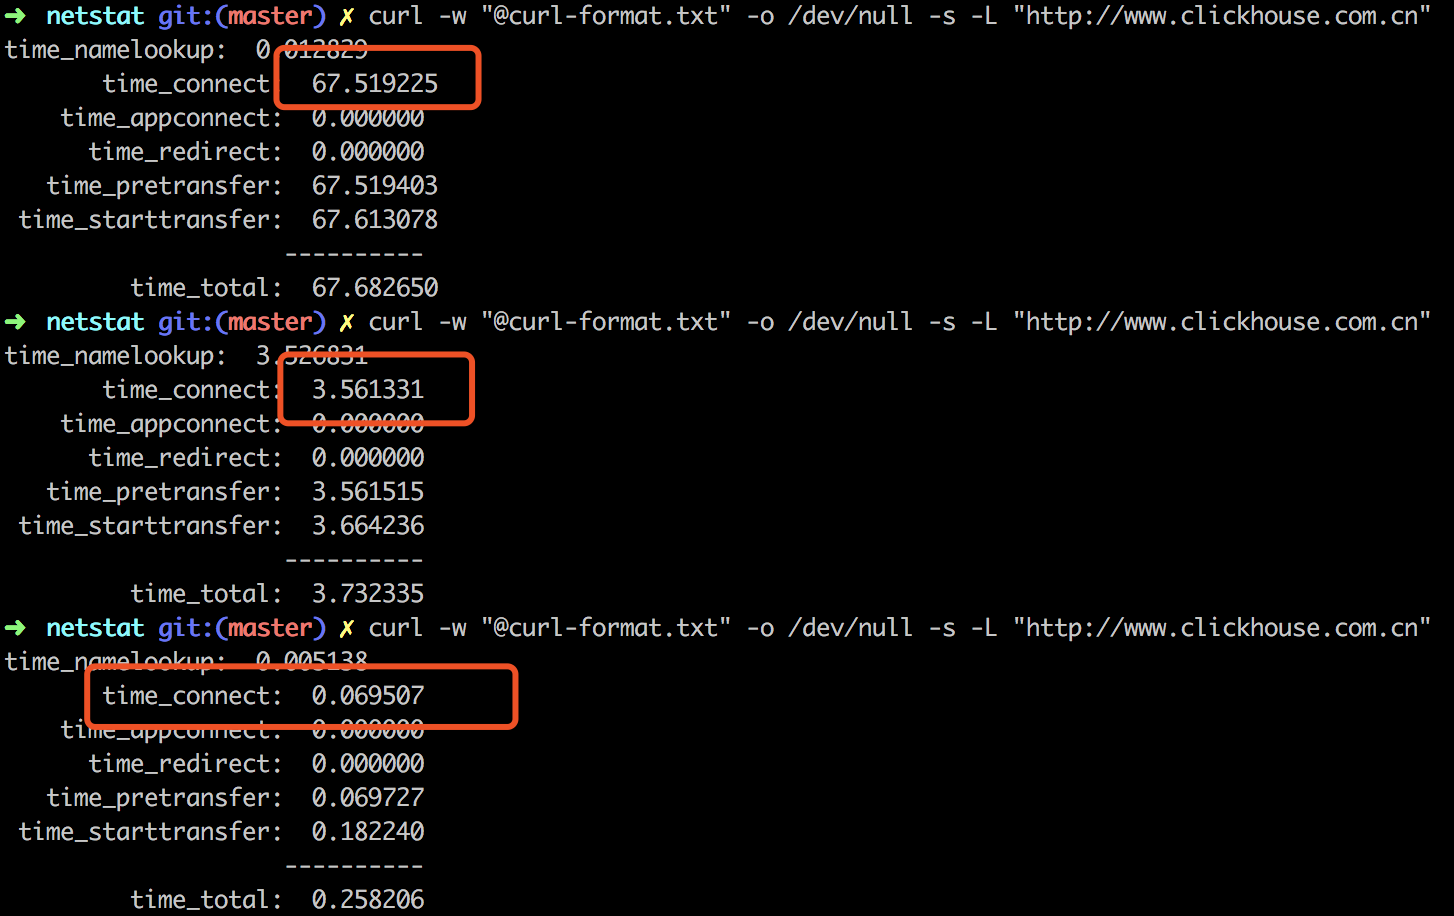
结论
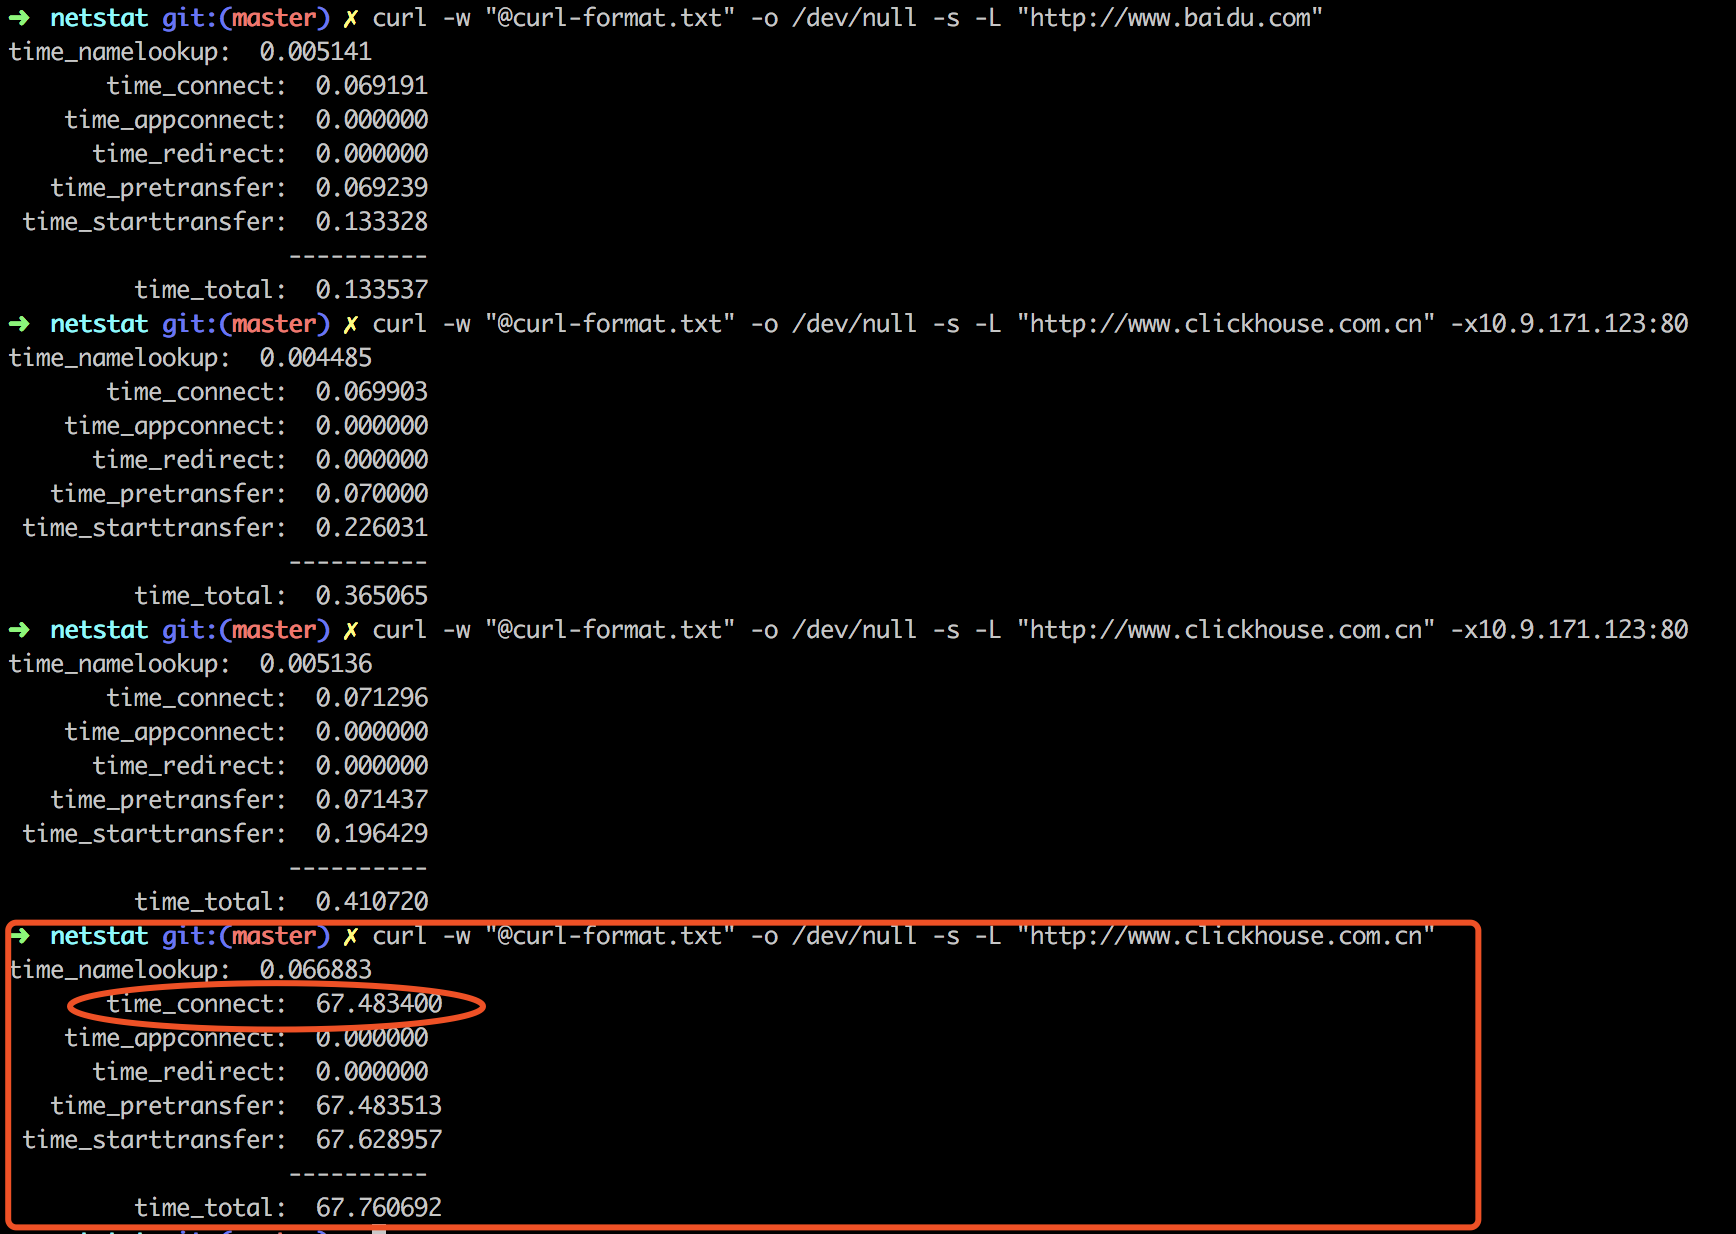
可以发现走外网ip, TCP 连接时间 所耗时间达到了68秒,但这个问题并不是持续出现,偶尔又非常快
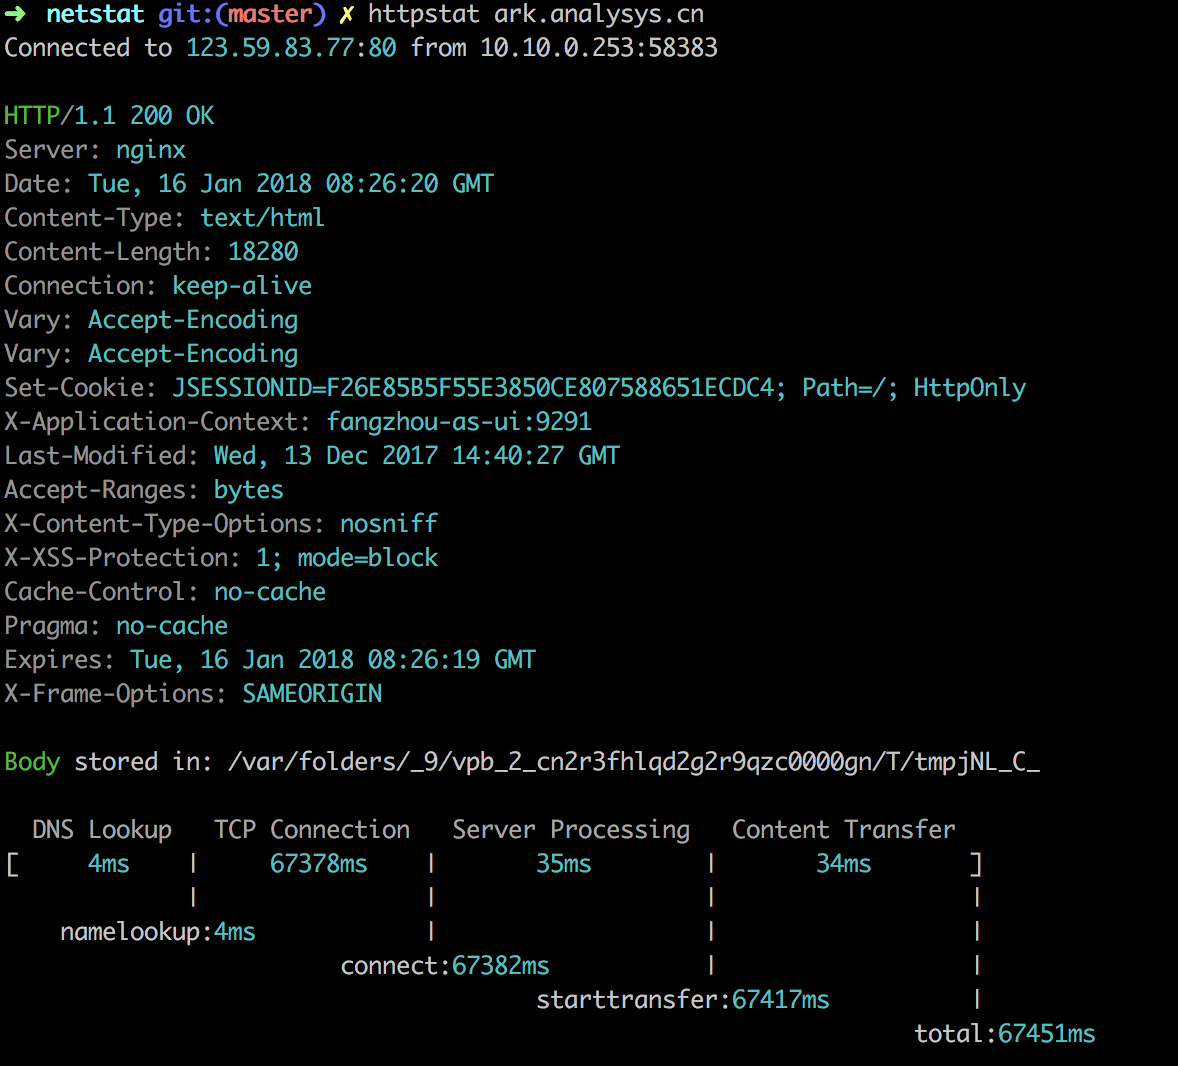
方式二,httpstat统计工具
参考httpstat
安装 httpstat
1 | pip install httpstat |
使用:
1 | httpstat www.clickhouse.com.cn |
nginx 状态检测
1.启用nginx status配置
1 | server { |
2.重启nginx
1 | /data/nginx/sbin/nginx -t |
3.打开status页面
执行:
1 | curl http://10.9.171.123/ngx_status -H "HOST: localhost |
结果:
1 | Active connections: 834 |
- active connections – 活跃的连接数量
- server accepts handled requests — 总共处理了21613286个连接 , 成功创建21613286次握手, 总共处理了49361716个请求
- reading — 读取客户端的连接数.
- writing — 响应数据到客户端的数量
- waiting — 开启 keep-alive 的情况下,这个值等于 active – (reading+writing), 意思就是 Nginx 已经处理完正在等候下一次请求指令的驻留连接
活跃连接数才800多,远没有超负荷运行
路由跟踪
1 | traceroute -m 15 -p 6888 10.9.171.123 |
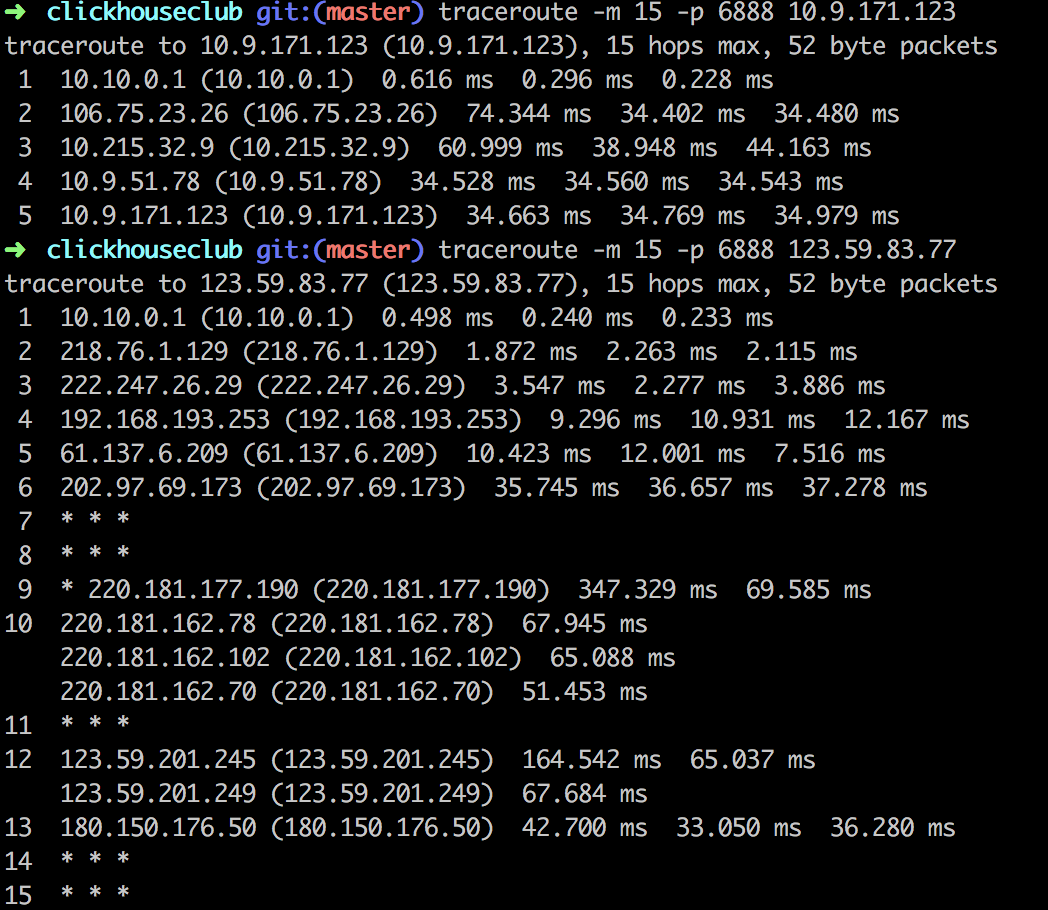
Traceroute能够显示到达目的地址所需的跳数、经过的路由器的IP地址、延时、丢包情况等信息。第一跳为10.10.0.1,第二跳为218.76.1.129,第三跳为xxxx;每条记录输出3个延时结果(源地址每次默认发送三个数据包);在第9条记录只有2个延时结果,说明源地址只收到了2个ICMP超时通知消息。
跨机房请求
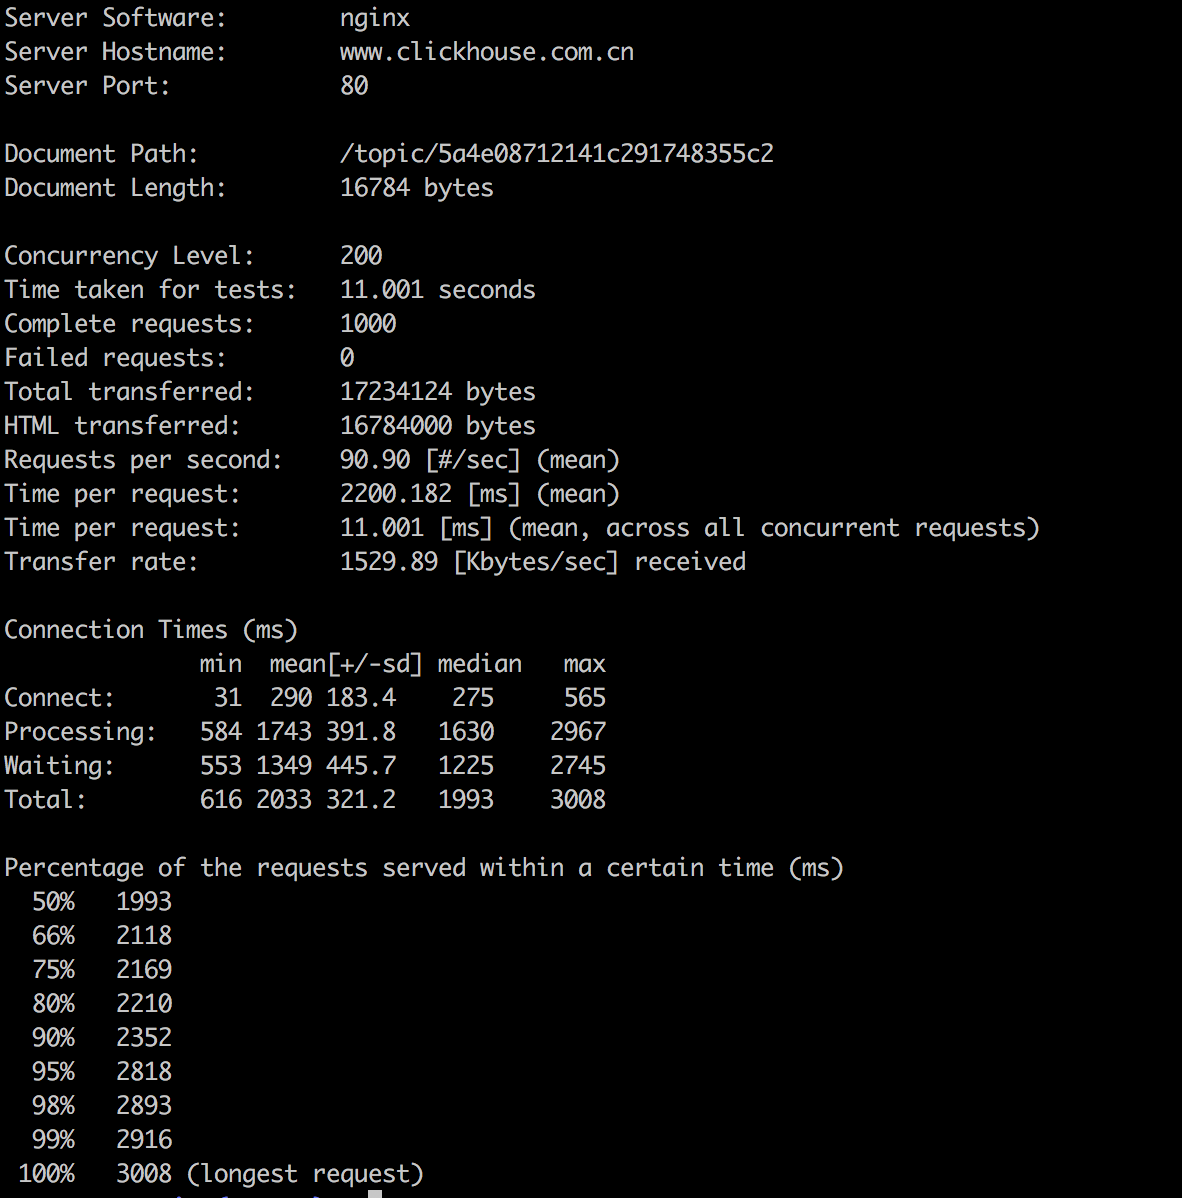
网站简单性能测试
如果步骤一中,服务器处理时间 耗时较长,可以试试用 ab命令做下简单压测
1 | ab -c 200 -n 1000 http://www.clickhouse.com.cn/ |