测试结果
| 对比项 | X2.0 | vectoria metircs | score |
|---|---|---|---|
| 写入吞吐 | x | 886k/s(1.66m/s) | |
| 压缩比(源json) | x | 0.22% |
benchmark 数据源配置
pod 4c6G
数据生成速率
1 | 3000*1230 active time series |
数据协议,prometheus remote write
数据格式(转json 后)
1 | {"metric":{"__name__":"node_scrape_collector_success","job":"node_exporter","instance":"host-2362","collector":"mdadm","replica":"0","revision":"r0","url_replica":"0"},"values":[1],"timestamps":[1724313603243]} |
Vectoria Metrics 测试过程
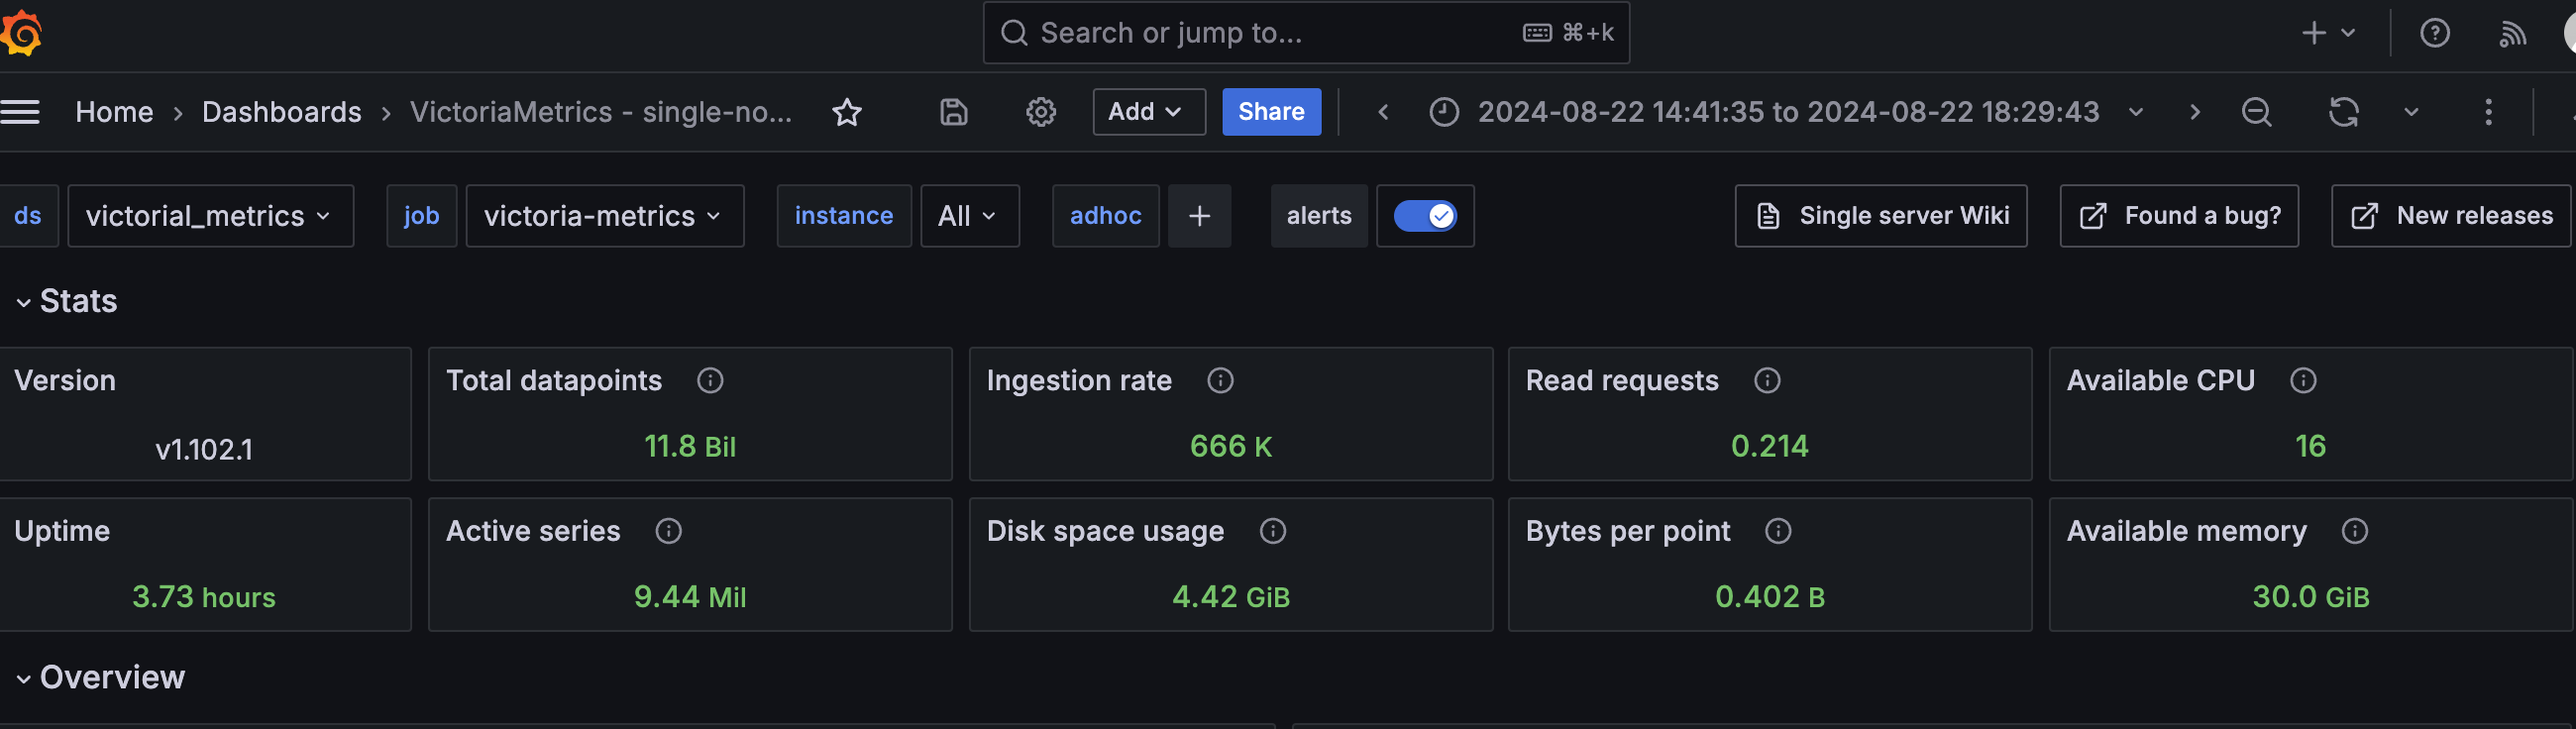
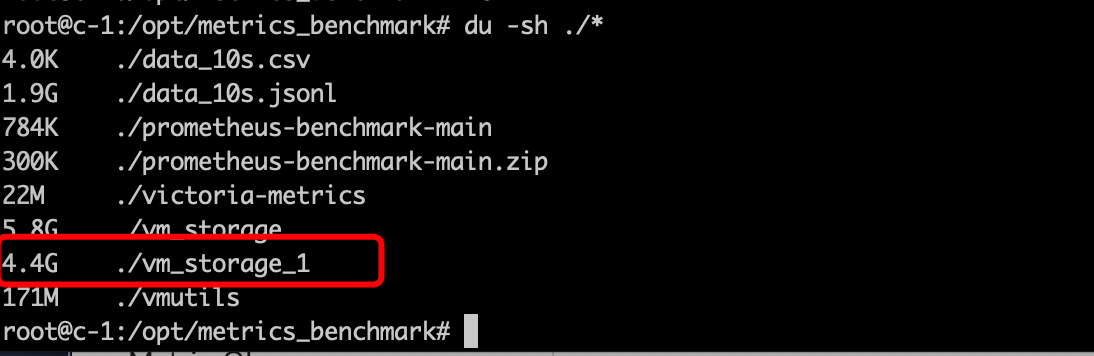
14:48分开始- 18:29分结束 , 总条数:11761224464 117.6亿 , 占用4.4G磁盘
压缩比
1 | vectoria_metrics 11761224464 117.6亿 4.4G |
写入吞吐
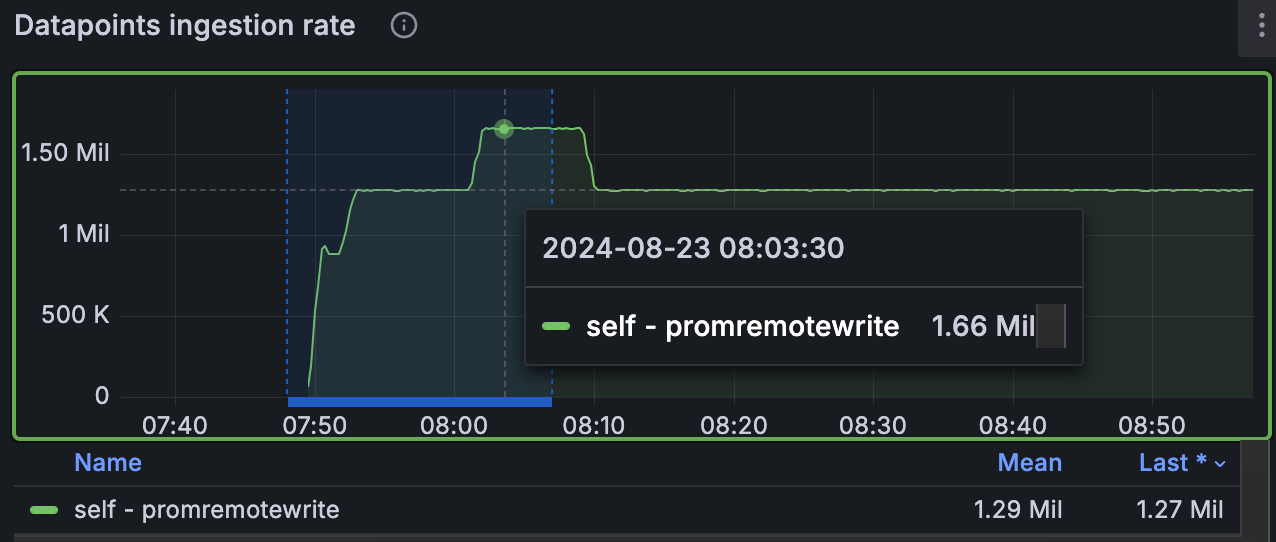
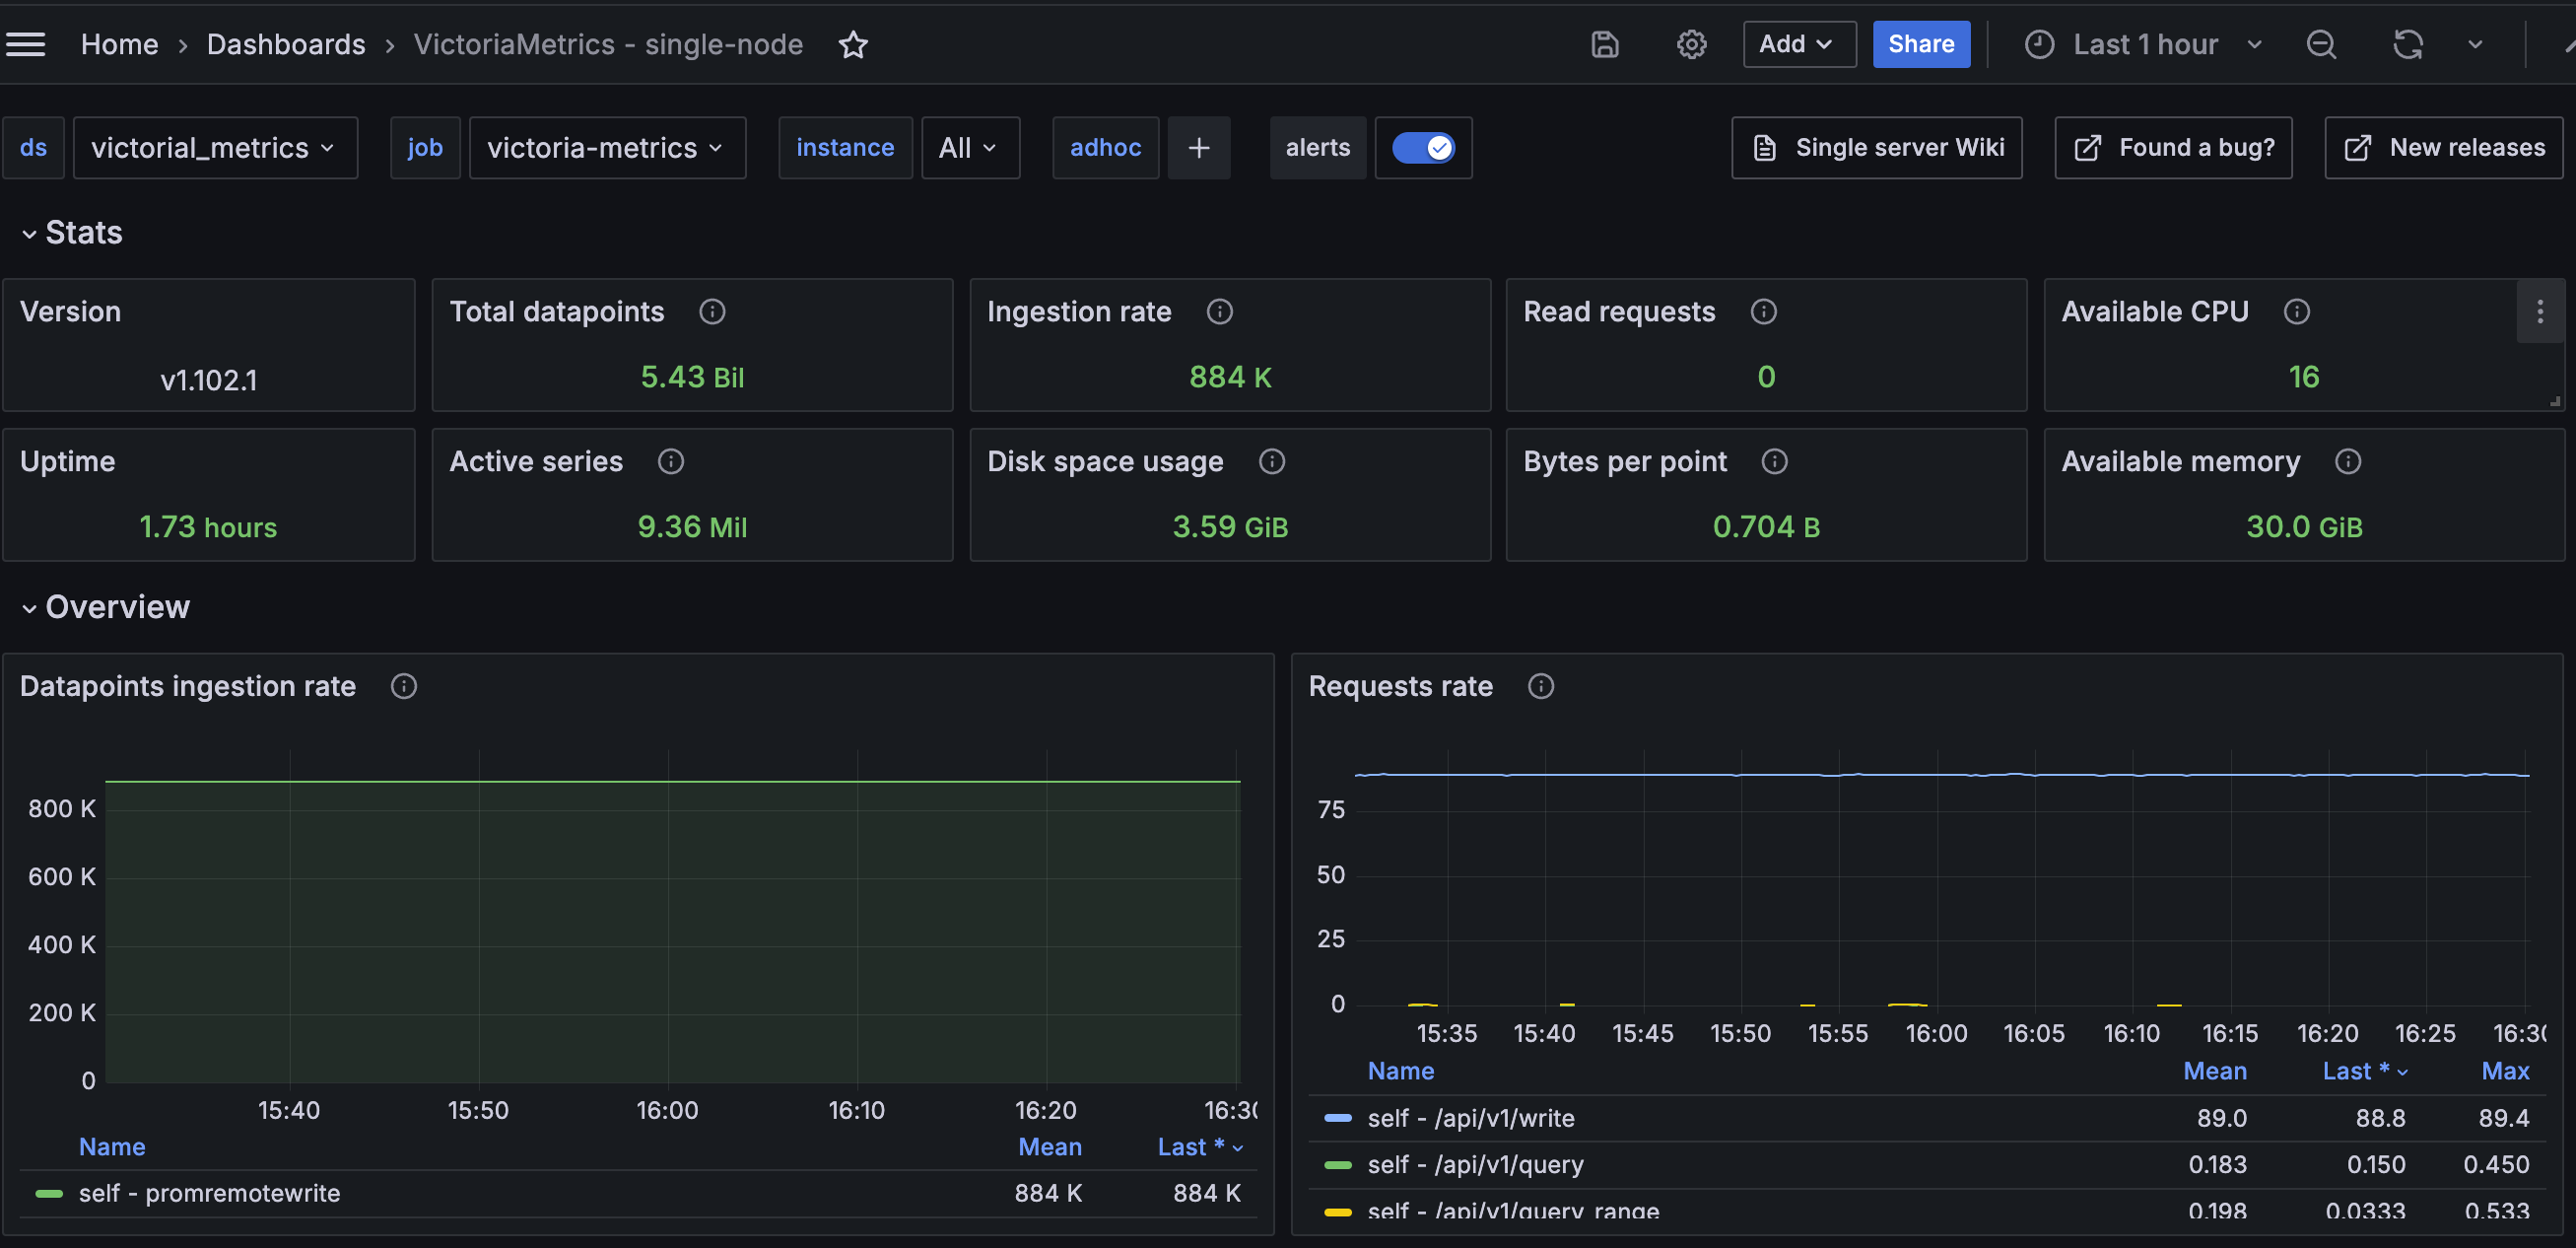
884k points/sec
中间试过起3个benchmark 同时打数据,2个 1.27m/s 3个到 1.66m/sec
消耗资源
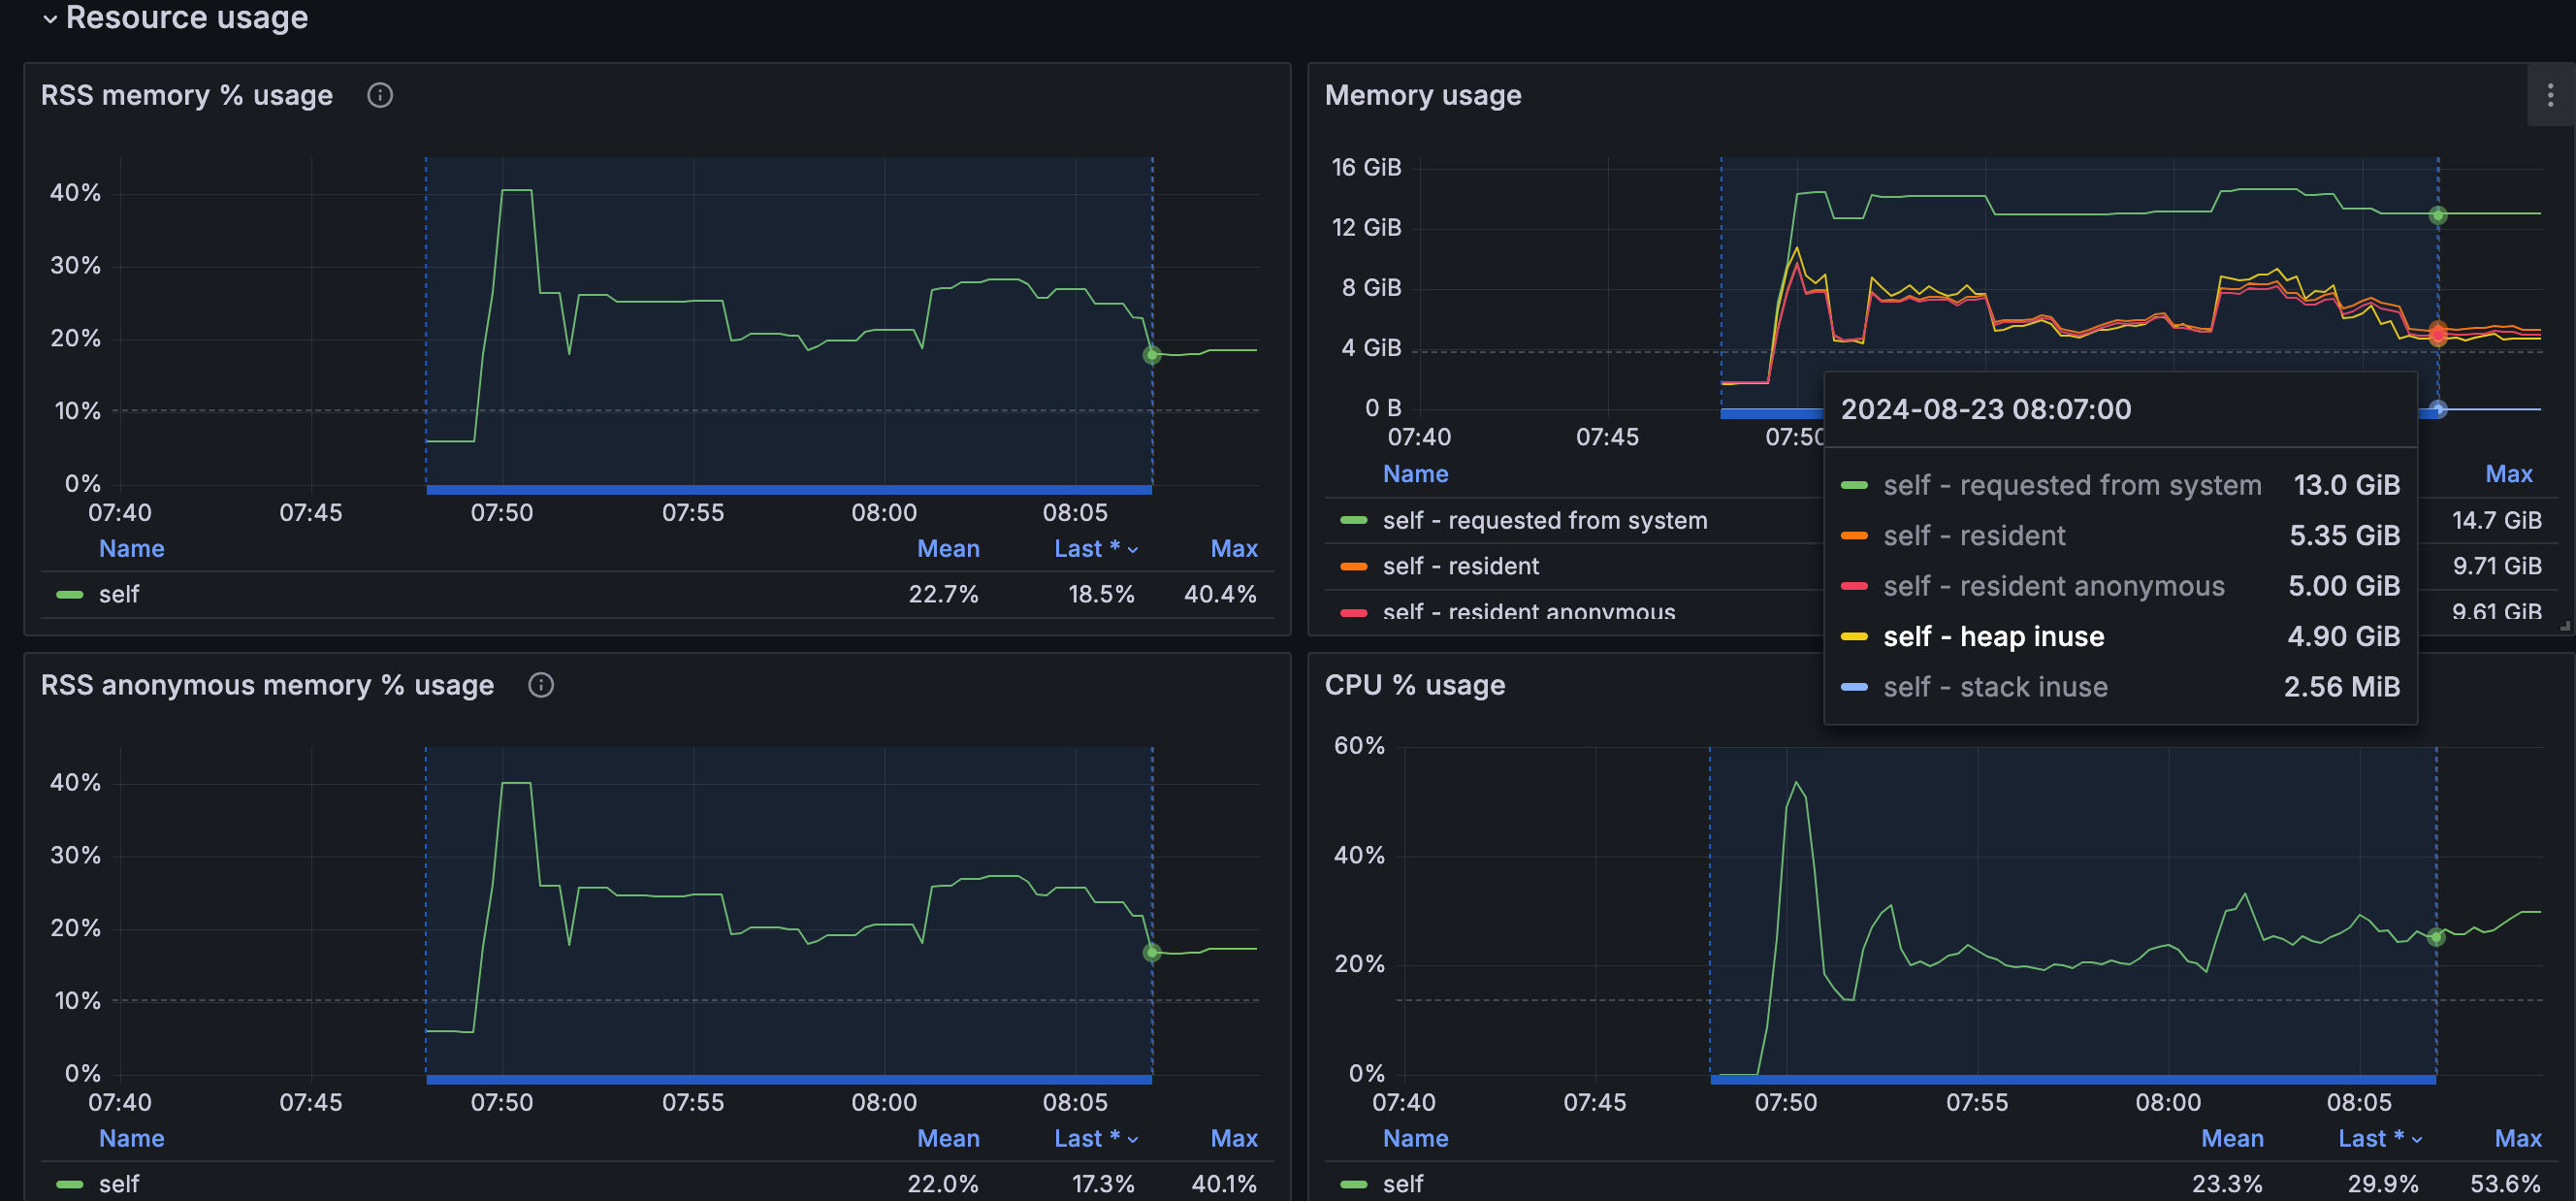
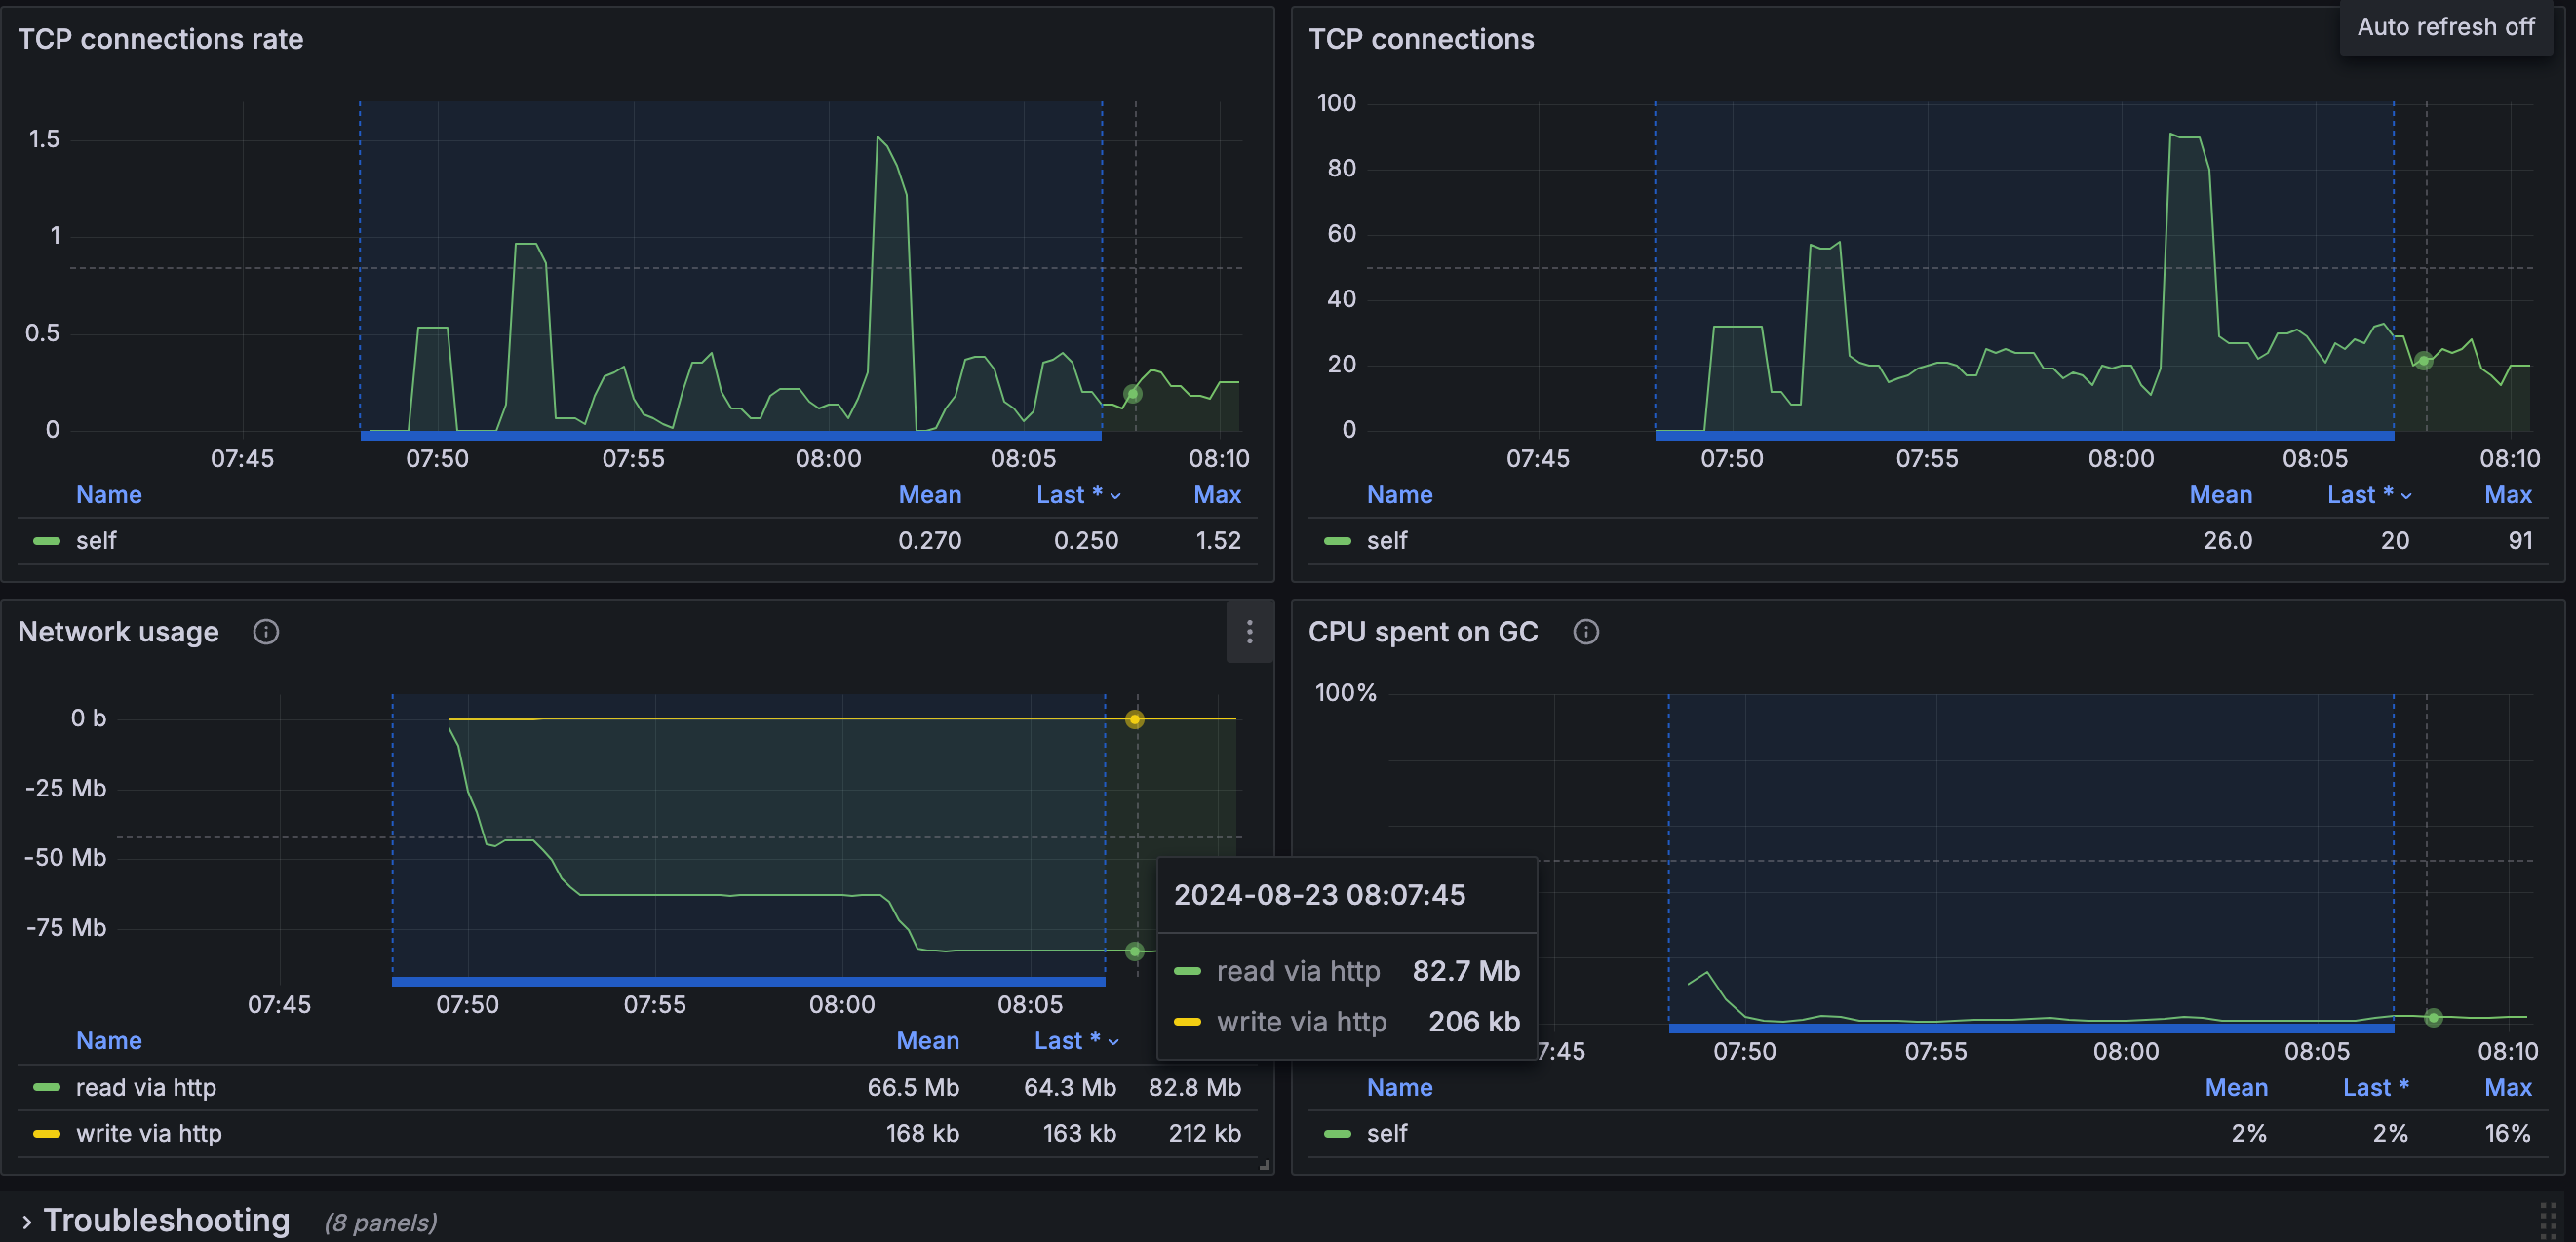
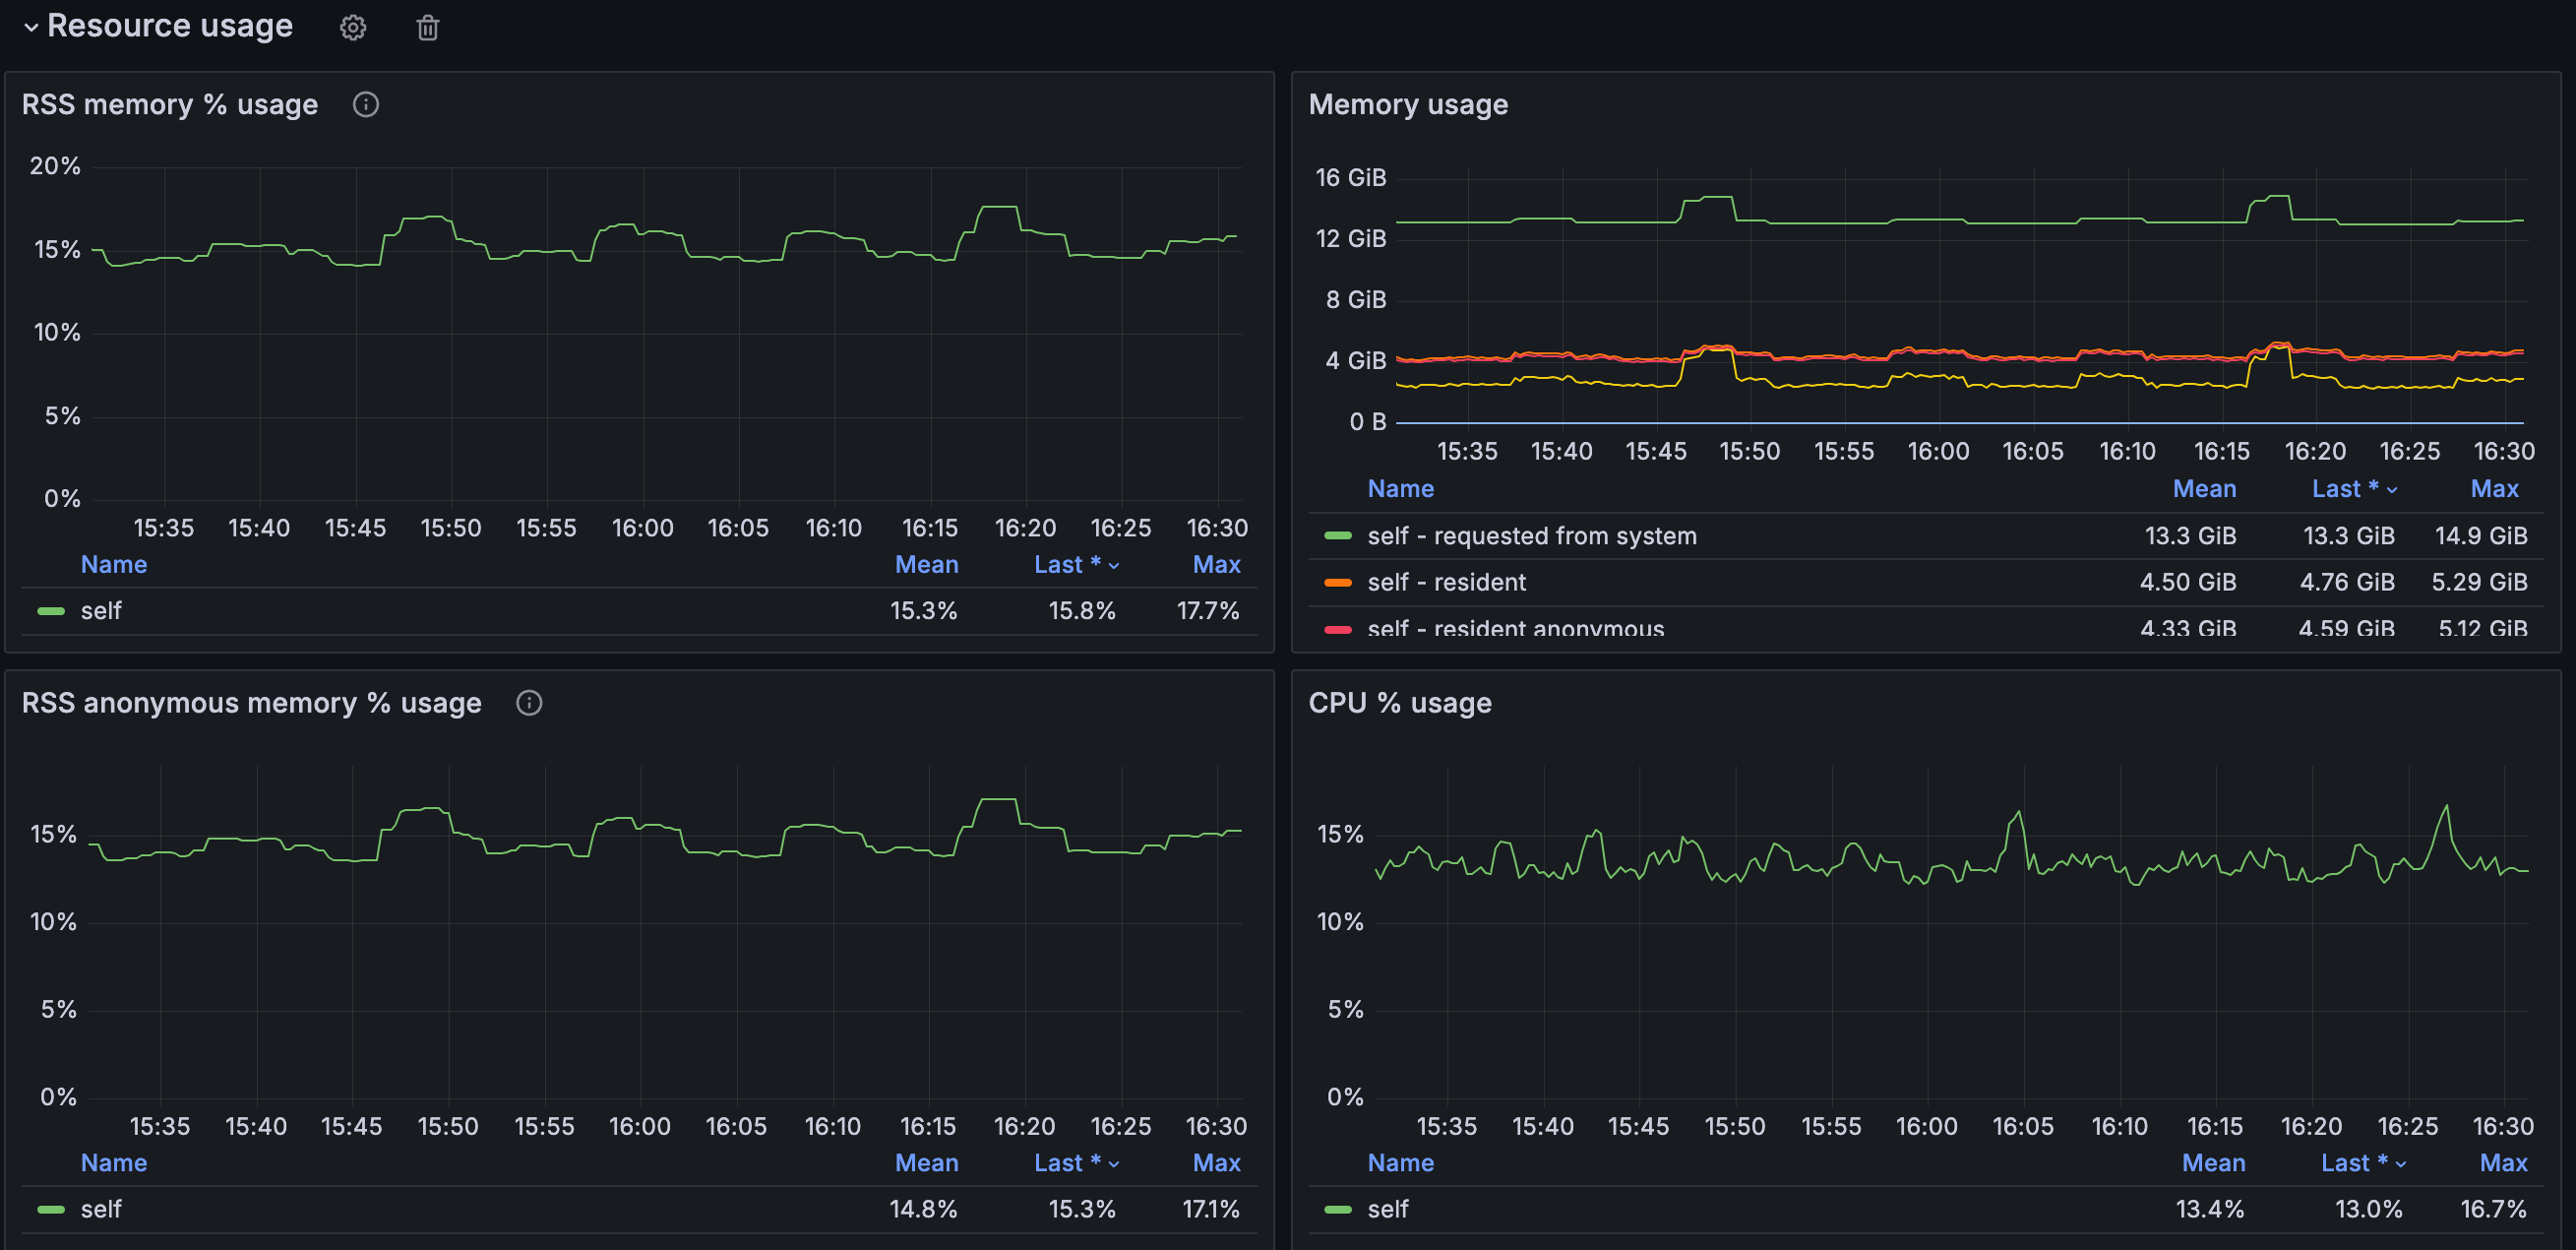
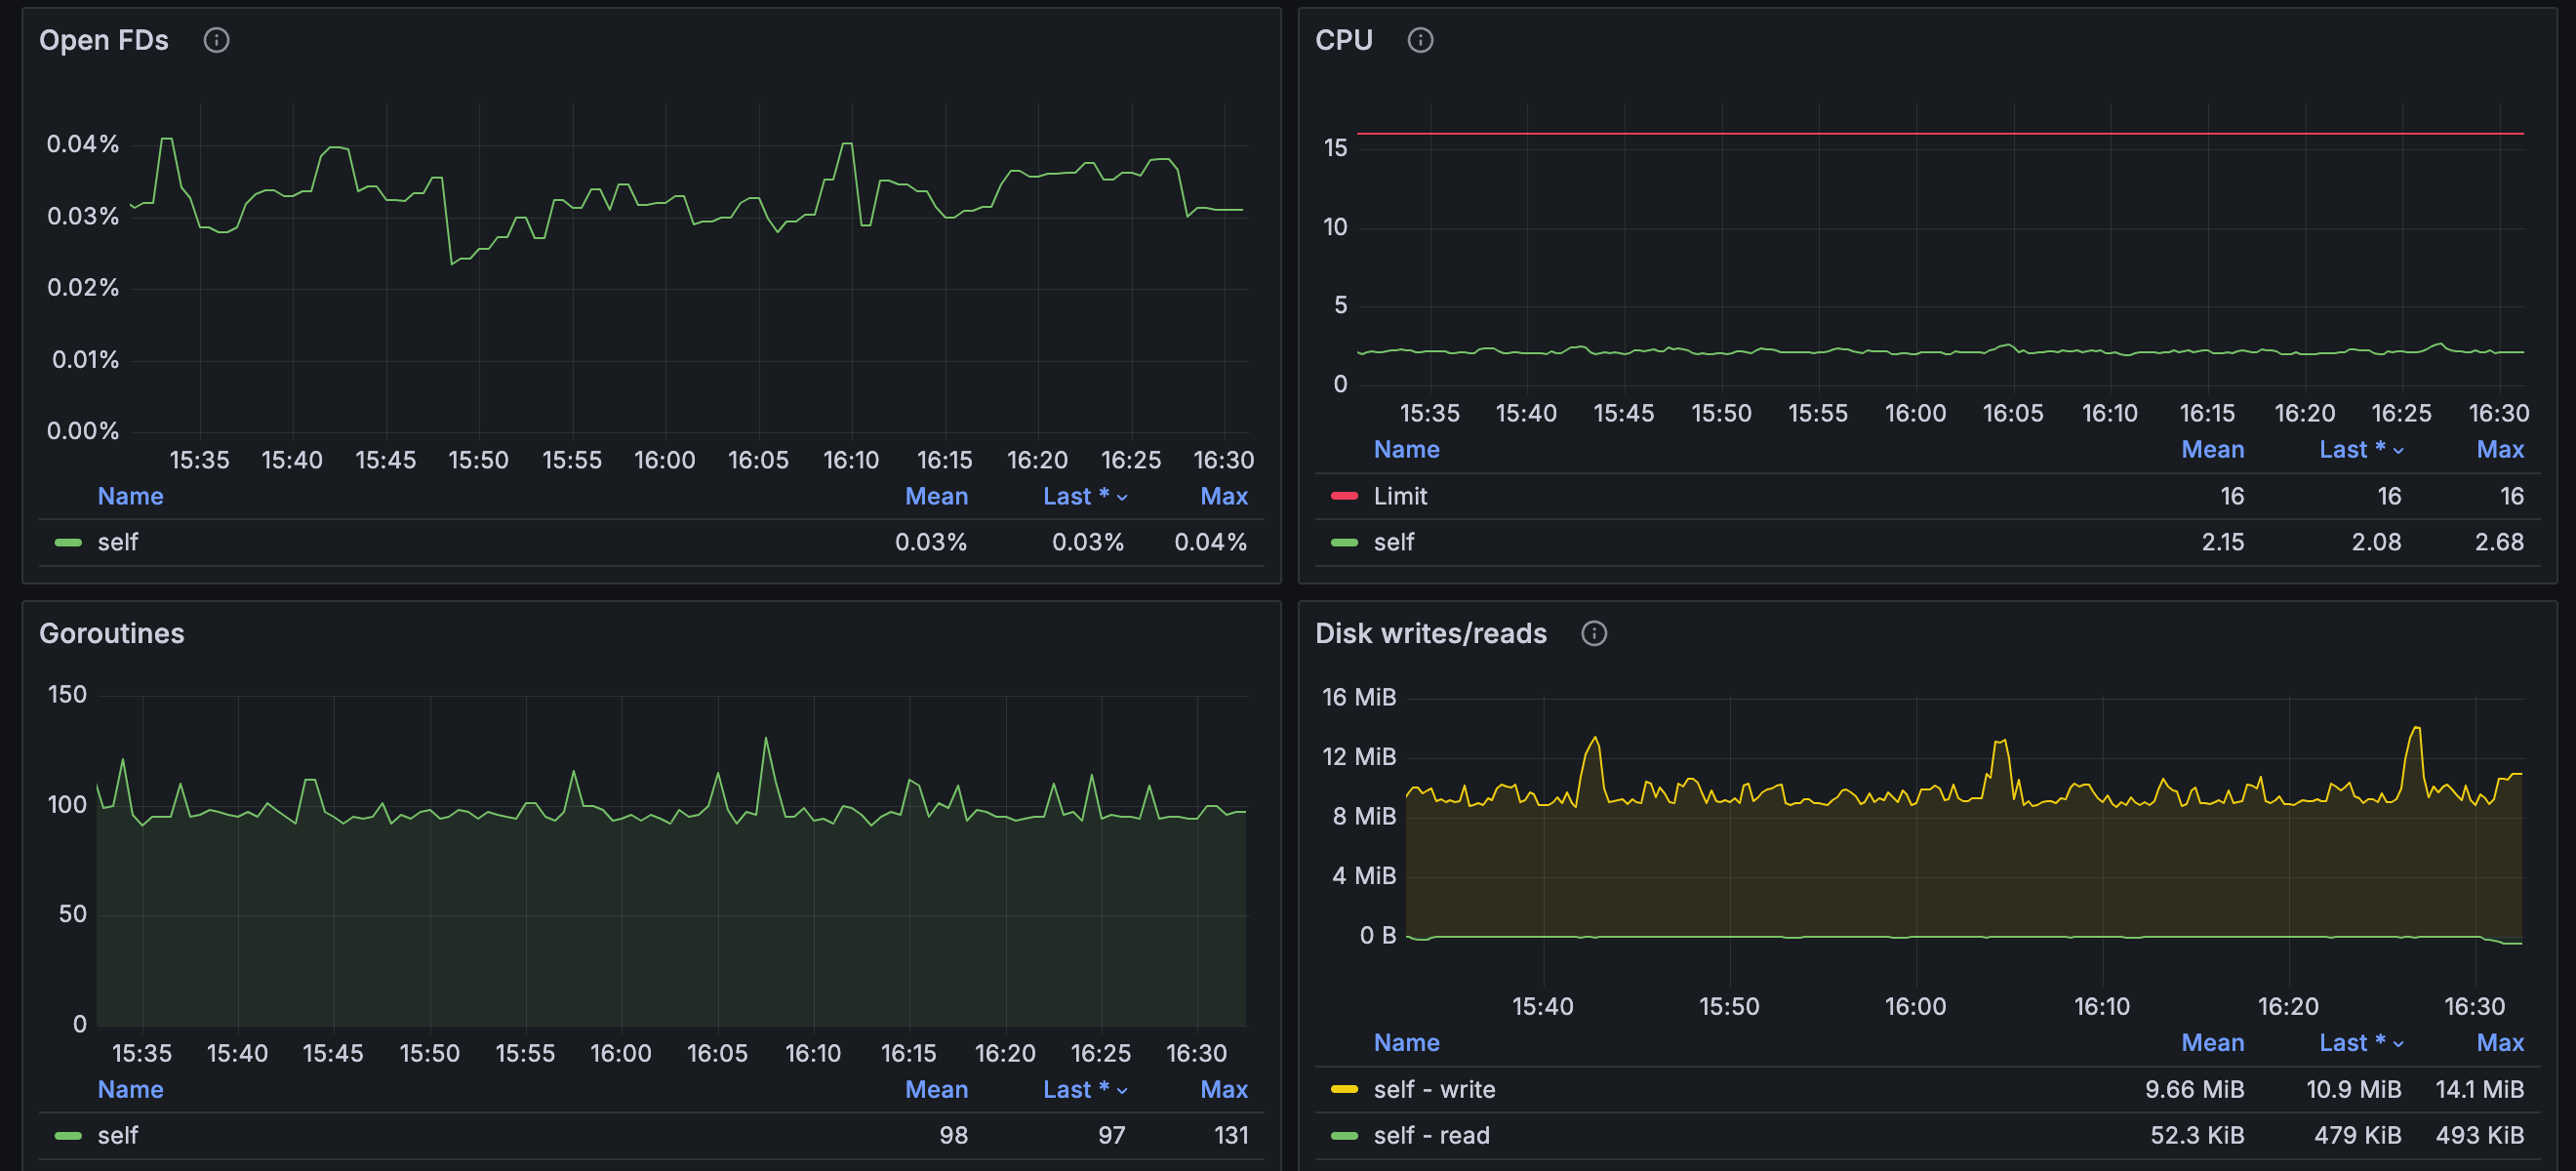
14% 的CPU使用率 CPU 2 (3个并发 23%)
网络 43Mb read( 82Mb) 磁盘写入9mb/s(3并发 16mb/s)
资源使用
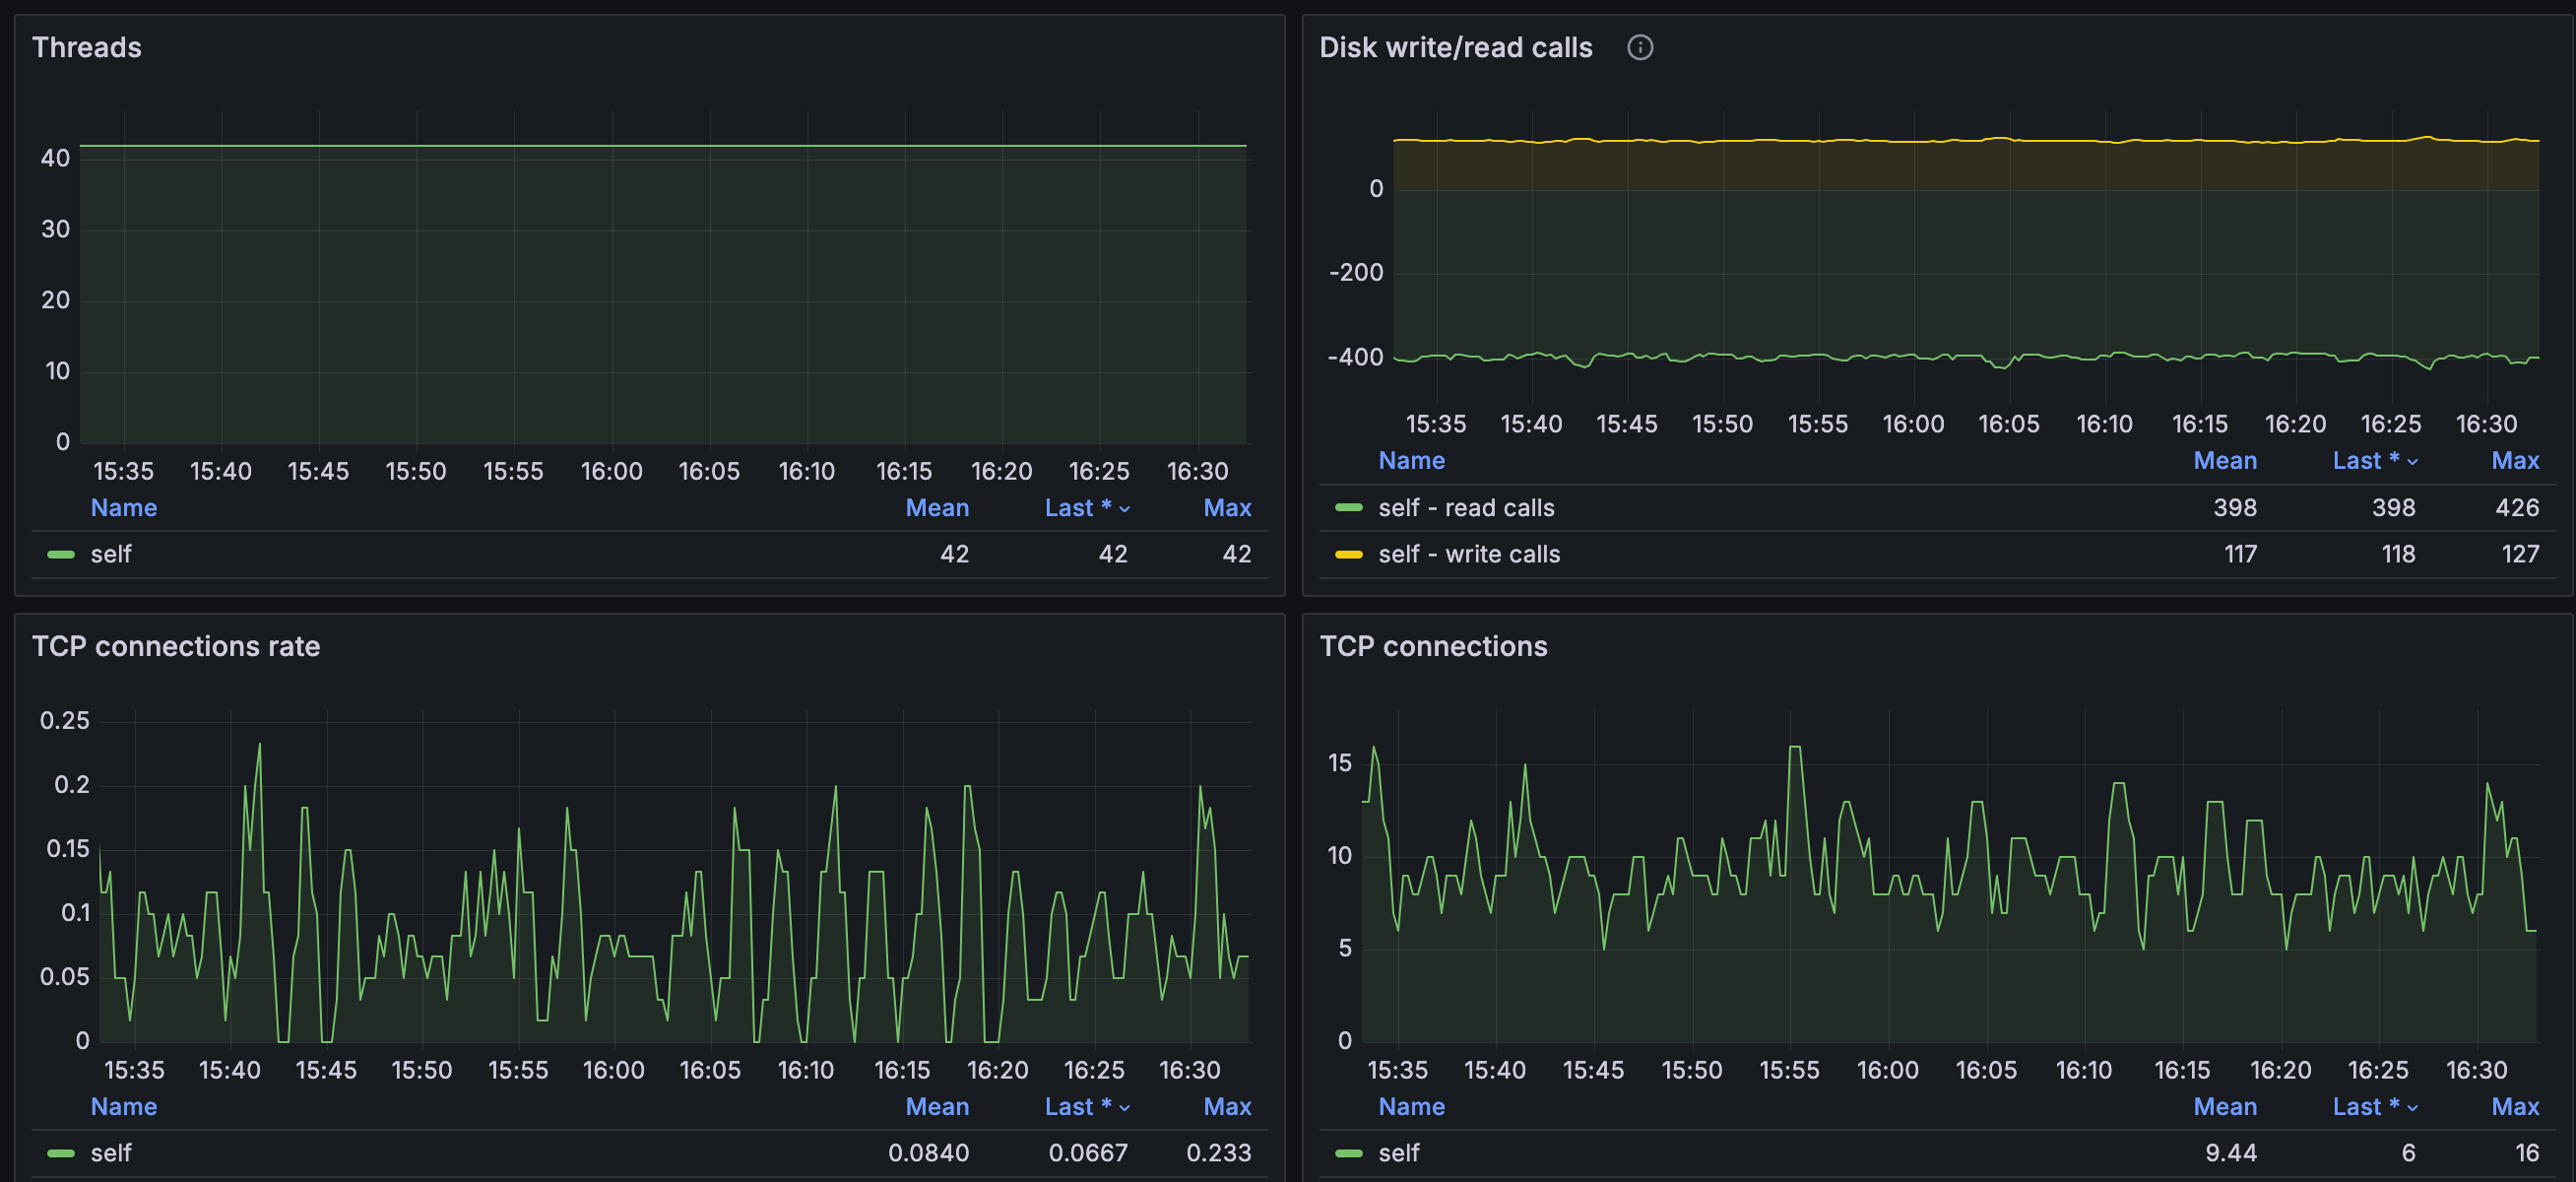
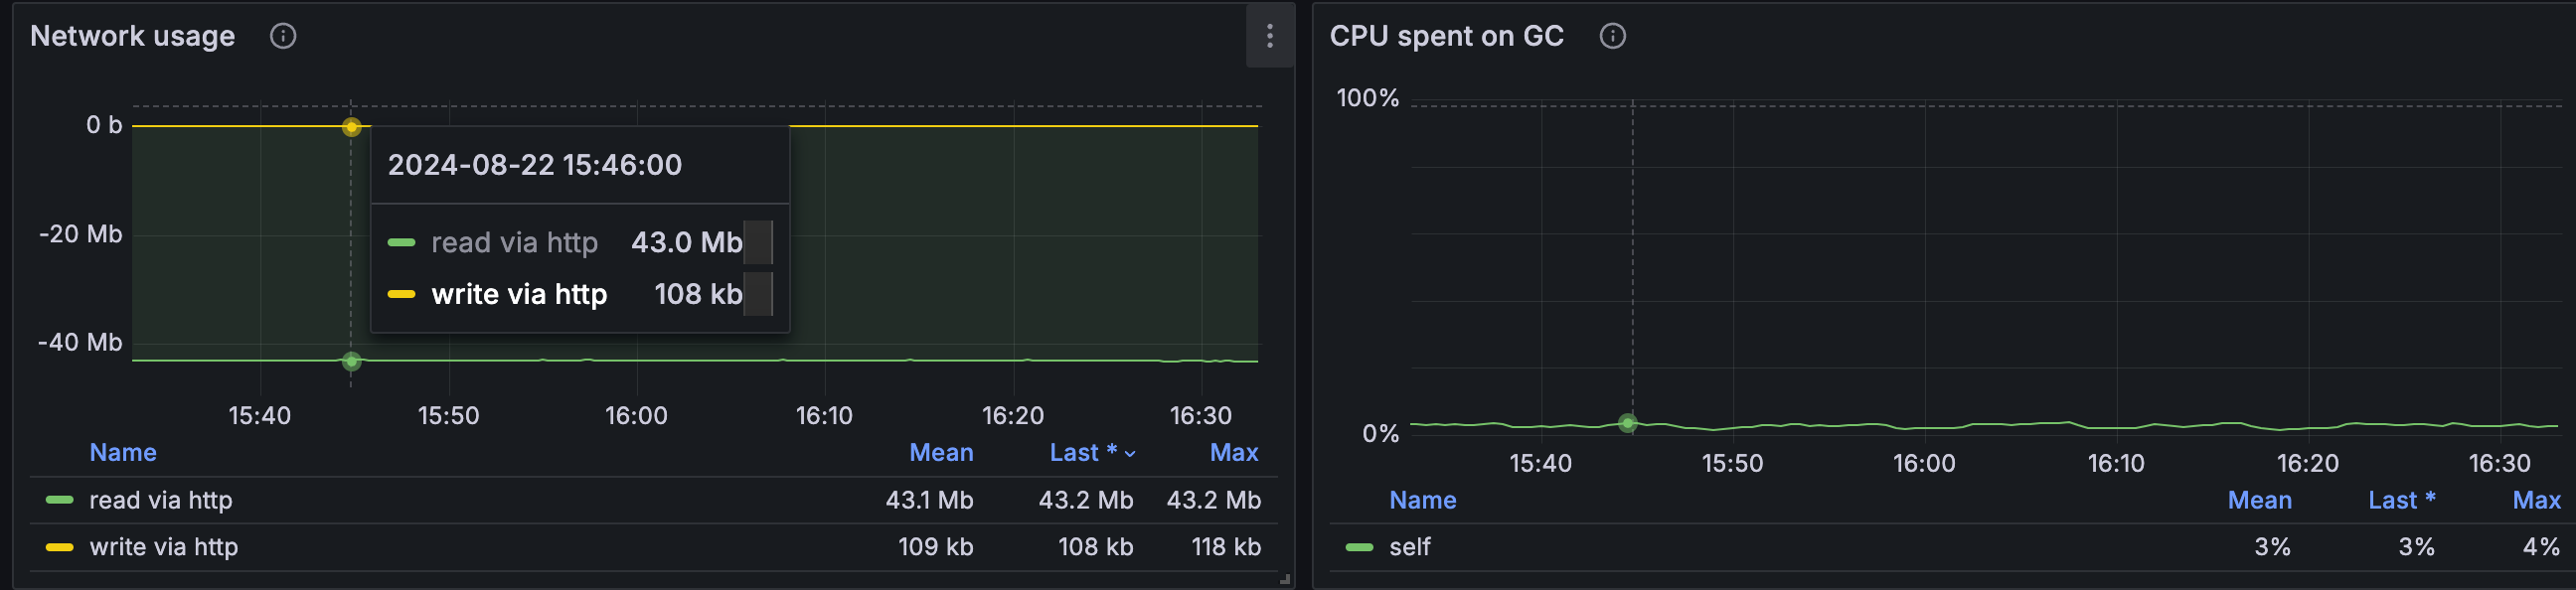
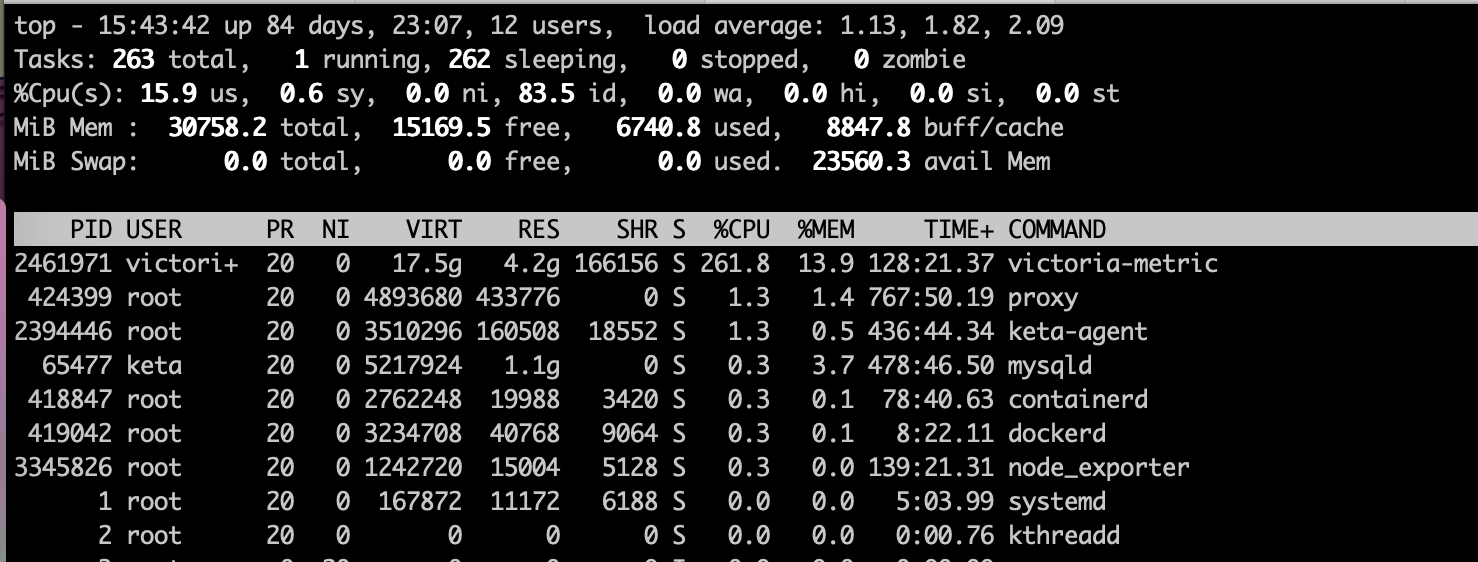
三个独立vmagent(3000 targets *3) 同时打数据
写入吞吐到 1.66m/s
资源使用平稳
(三级跳现象: 陆续启动3个打数的agent)
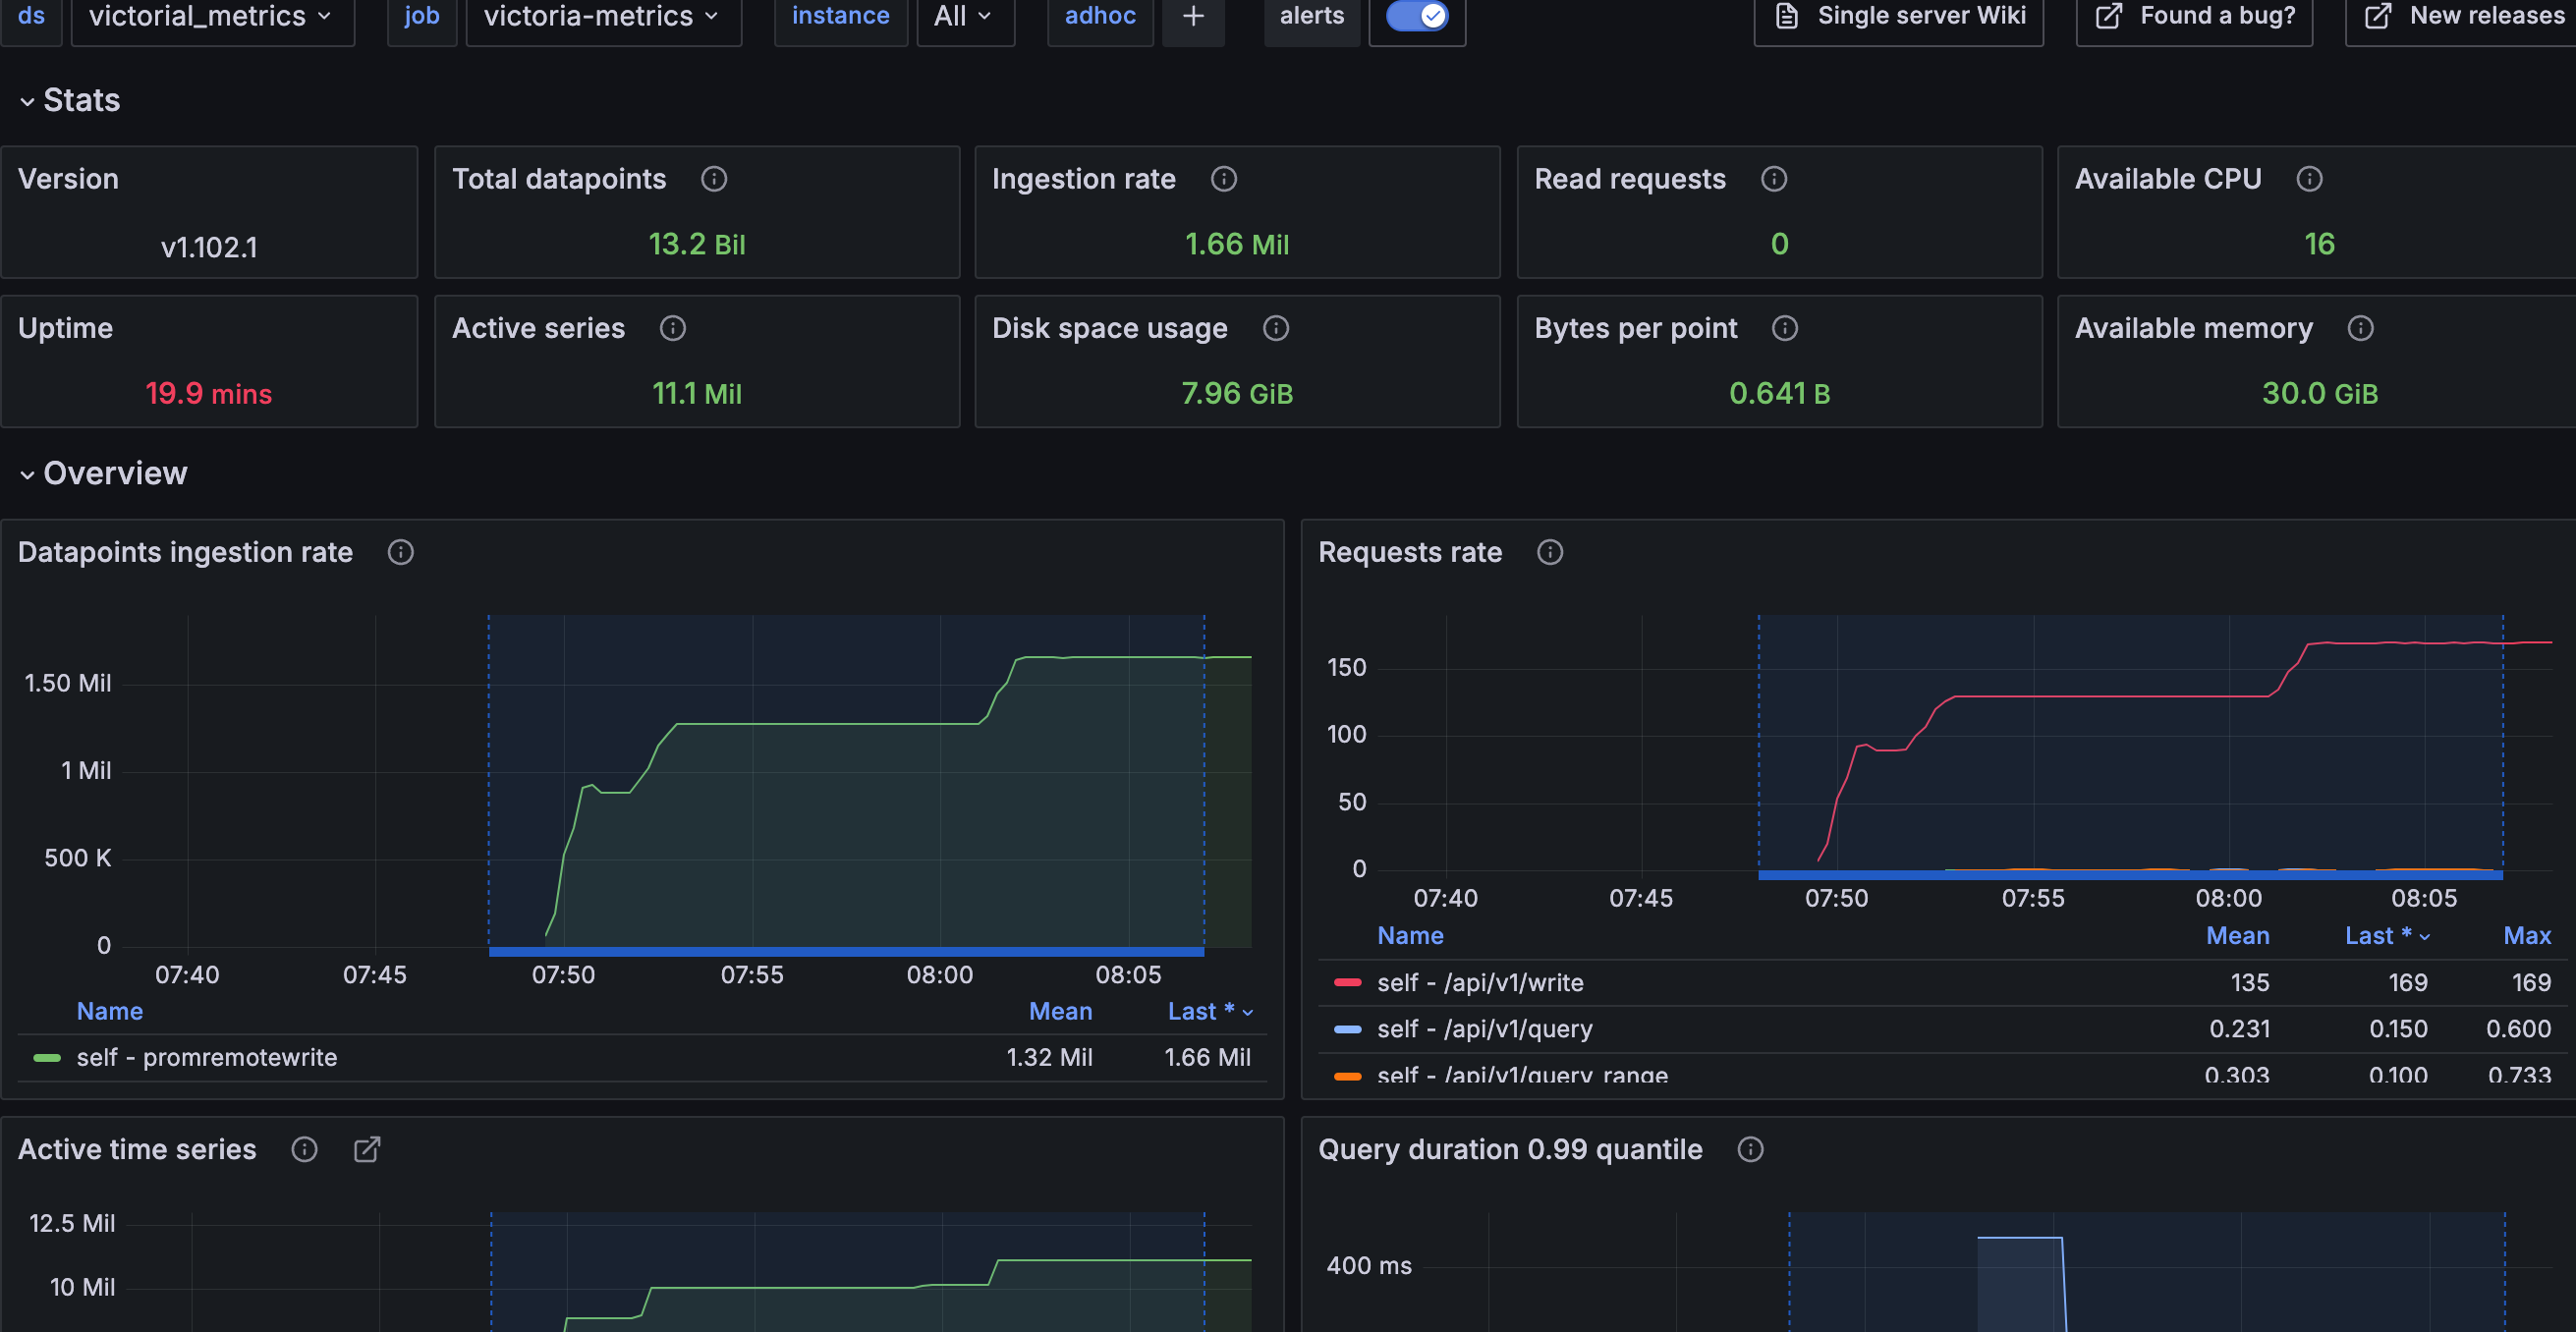
内存在 agent初始接入时会有大幅上升,1分钟左右降下来后就比较平稳